

Century 21 People’s Choice Realty Inc., Brokerage
120 MATHESON BLVD E #103
MISSISSAUGA, Ontario
L4Z 1X1
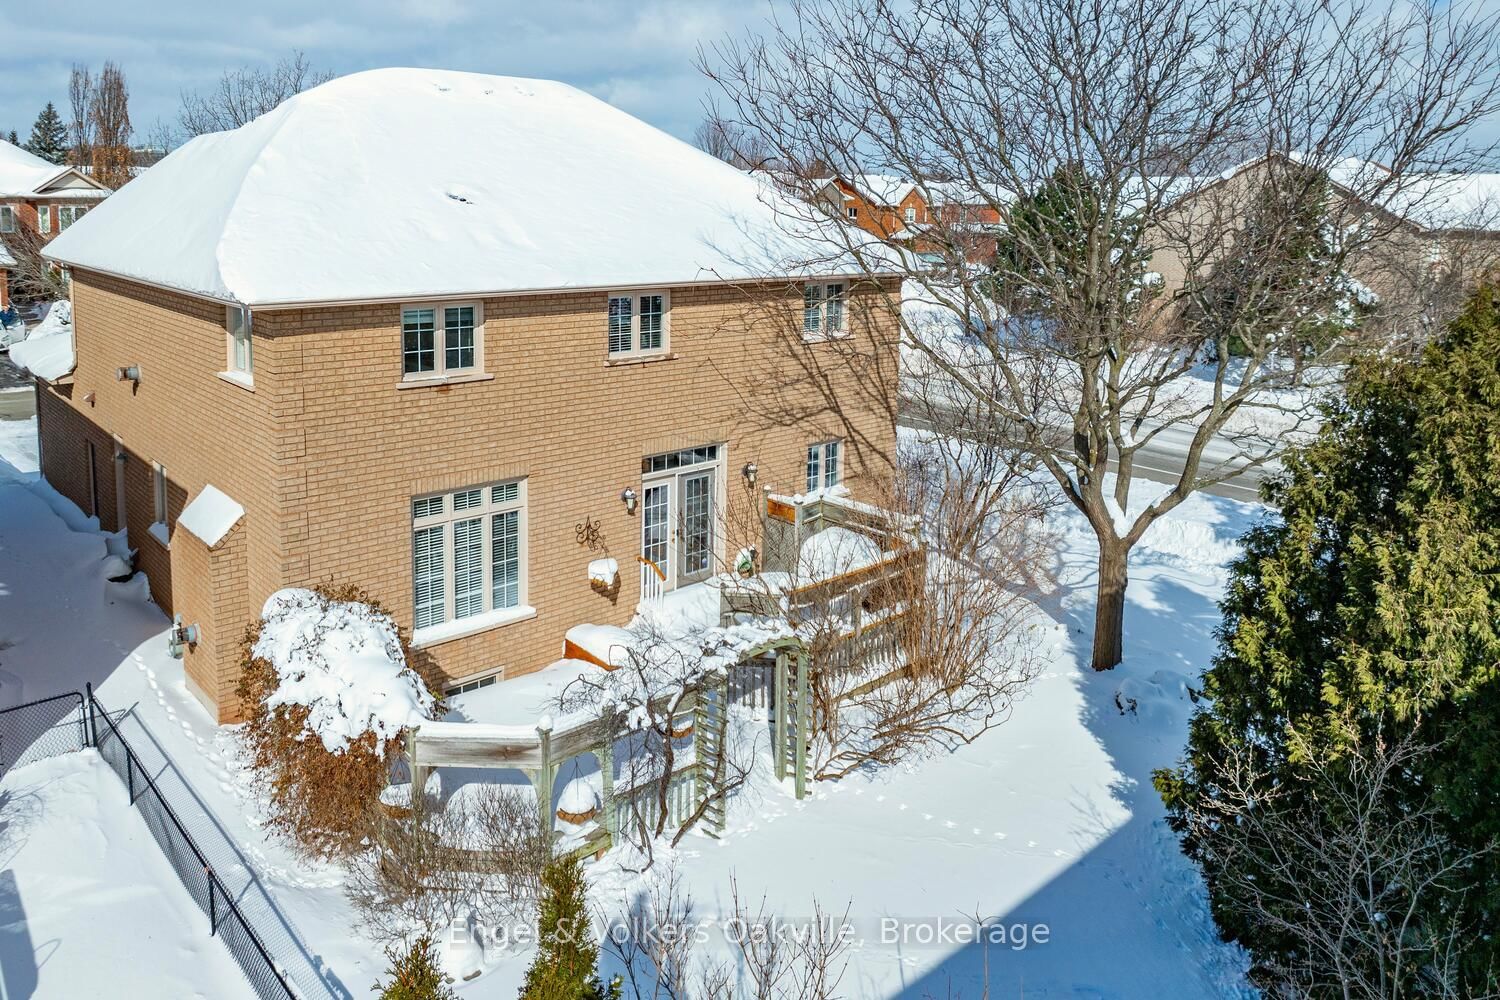

Oakville, WM Westmount, L6M 3P3
$1,649,000$000000
Listed by Engel & Volkers Oakville.
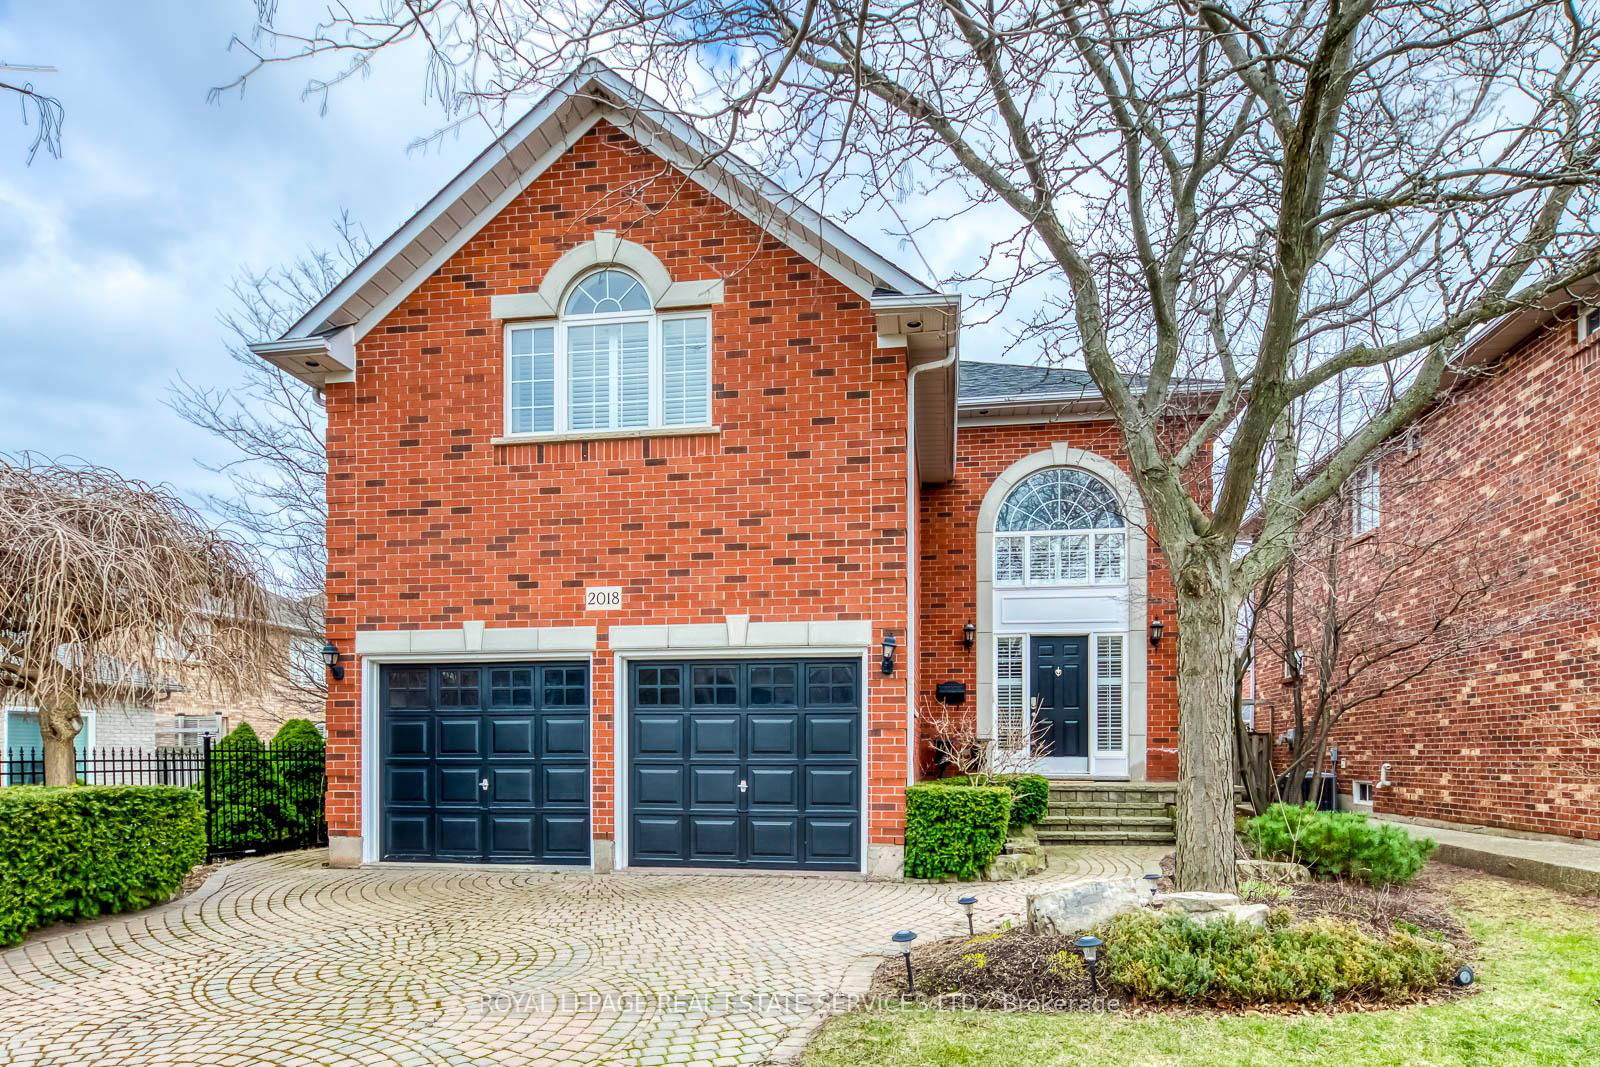
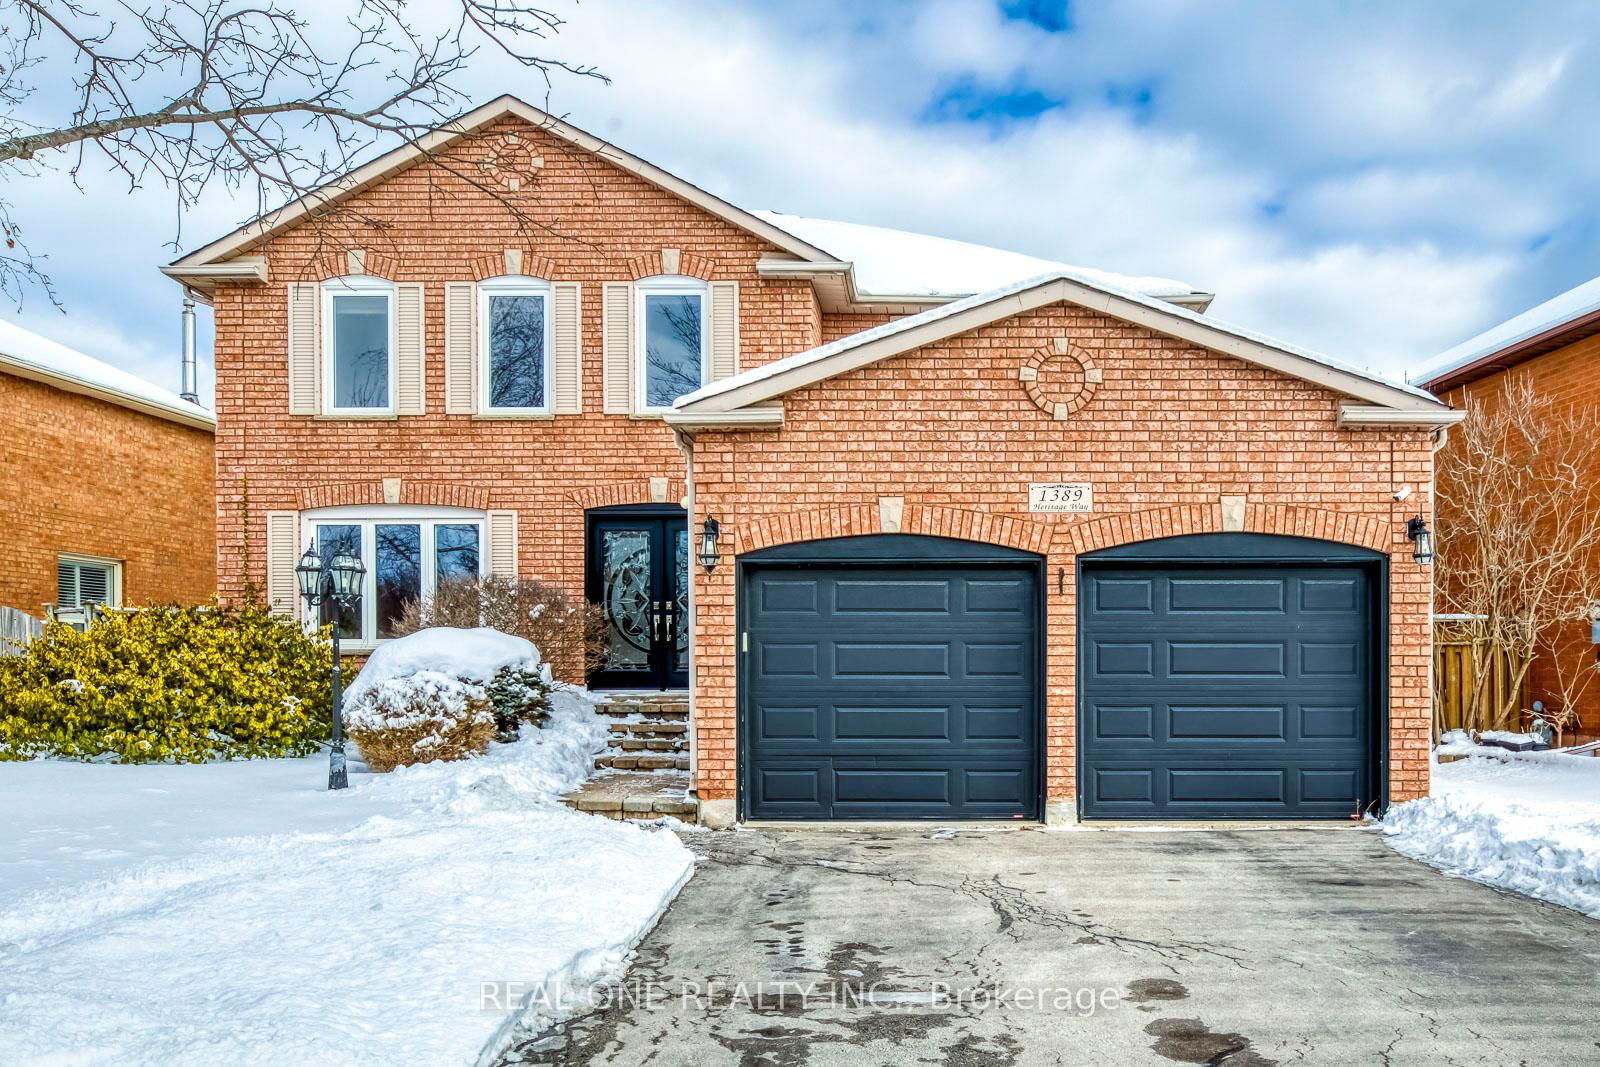
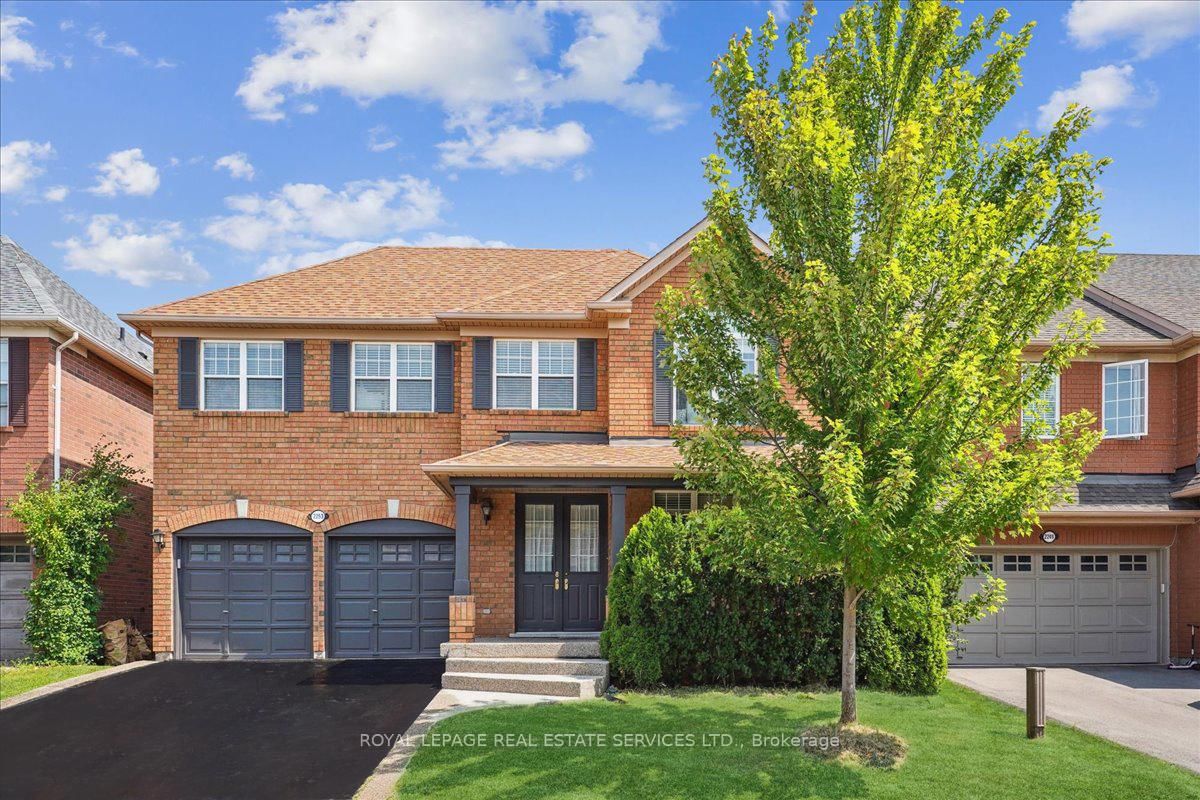
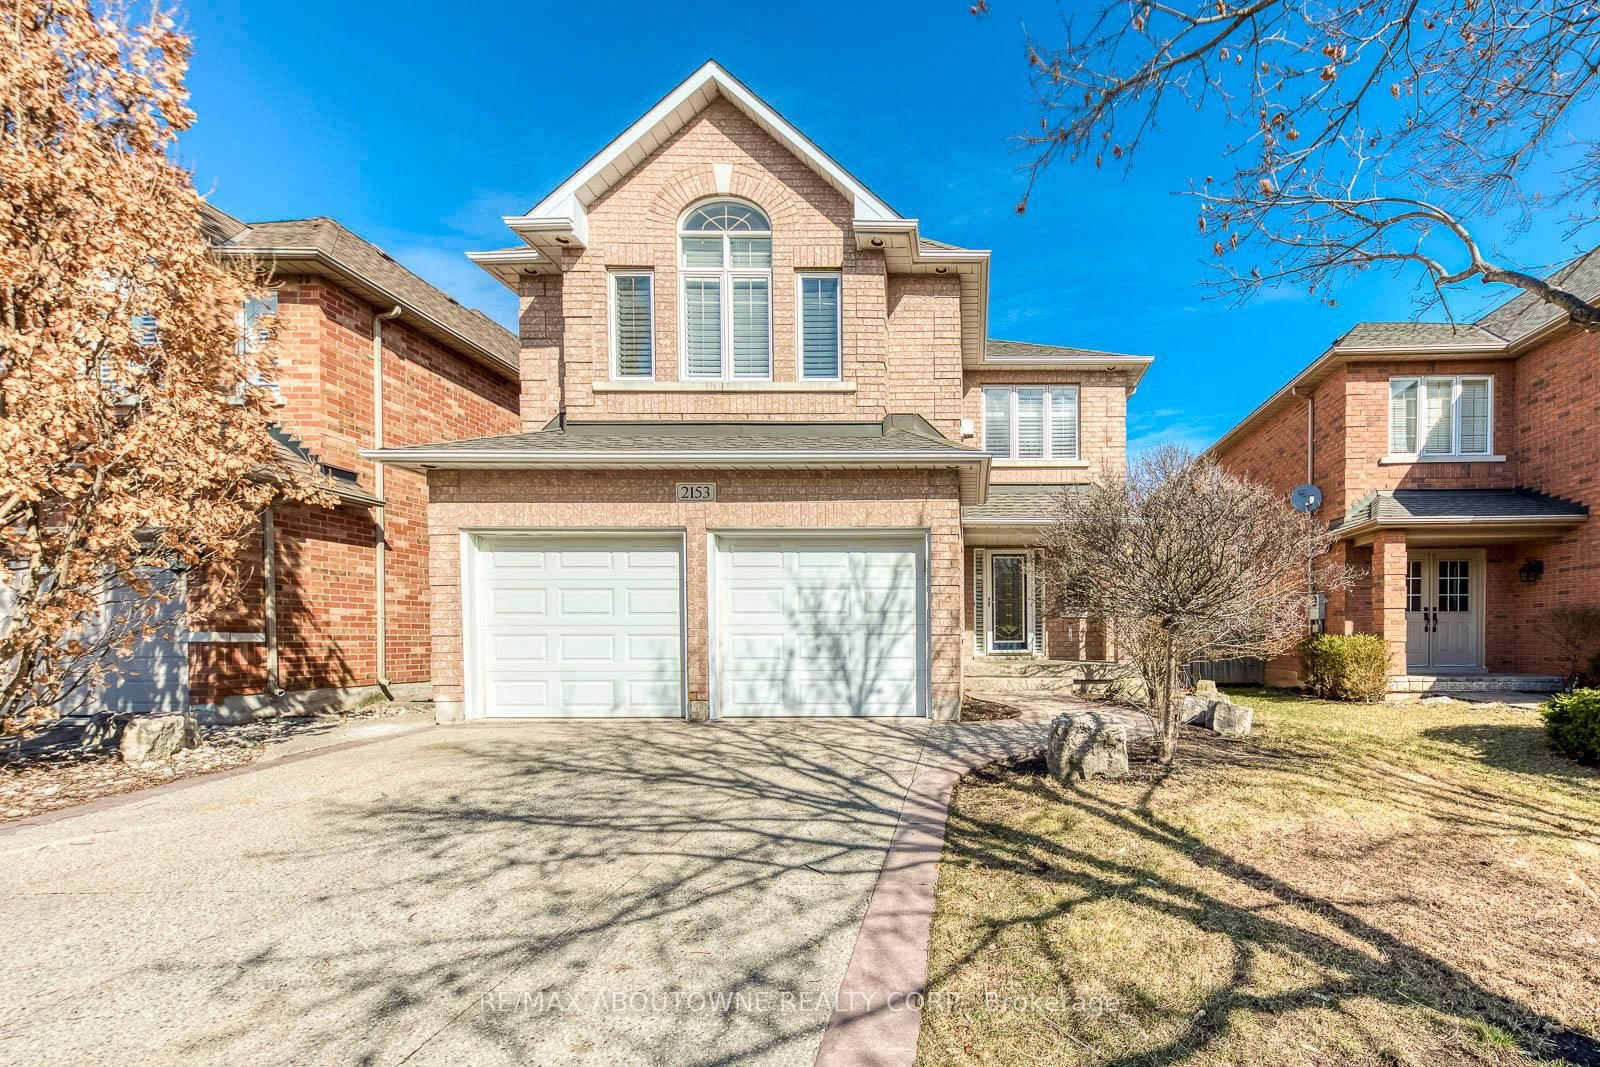
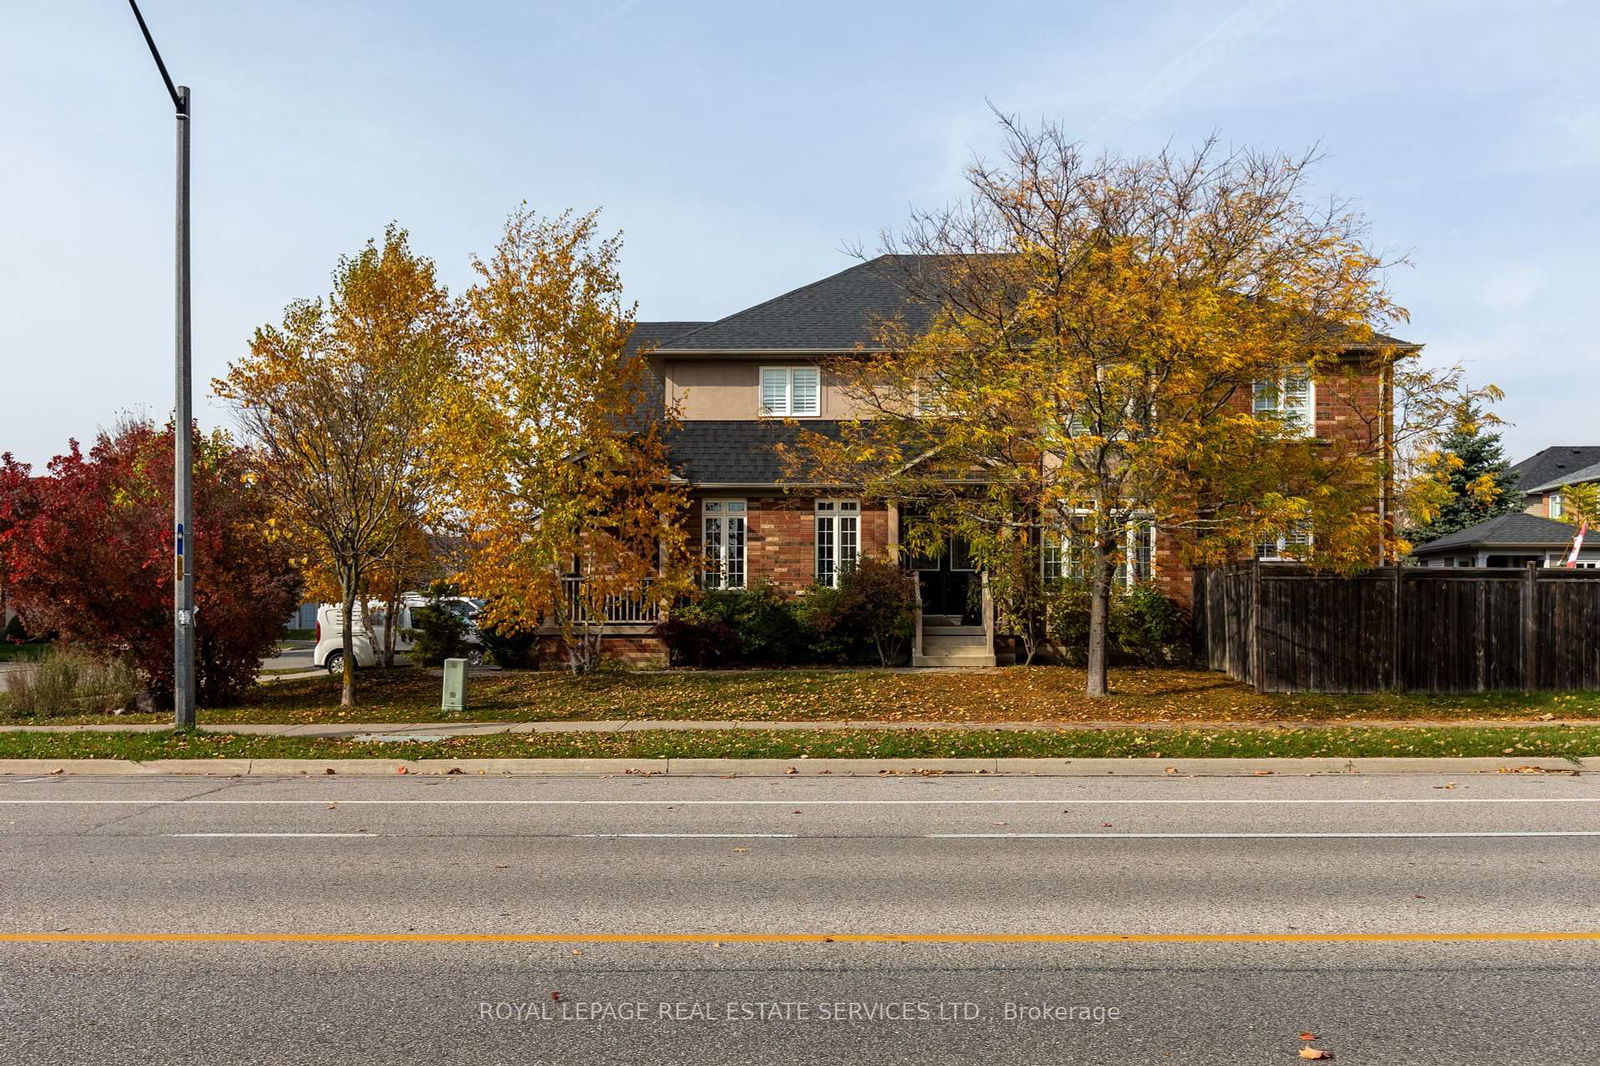
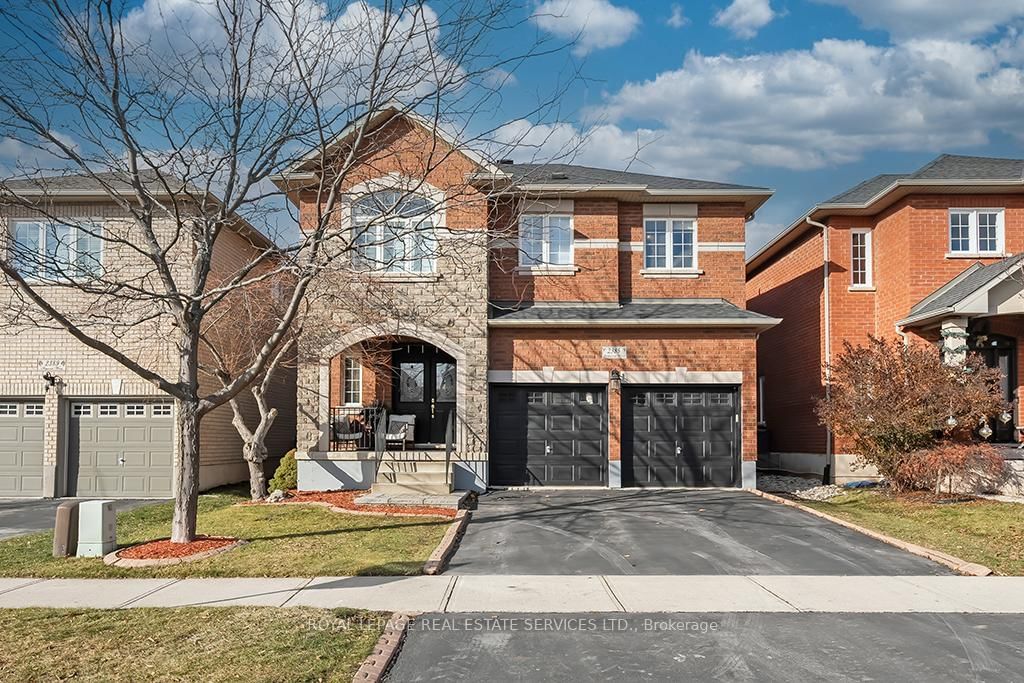
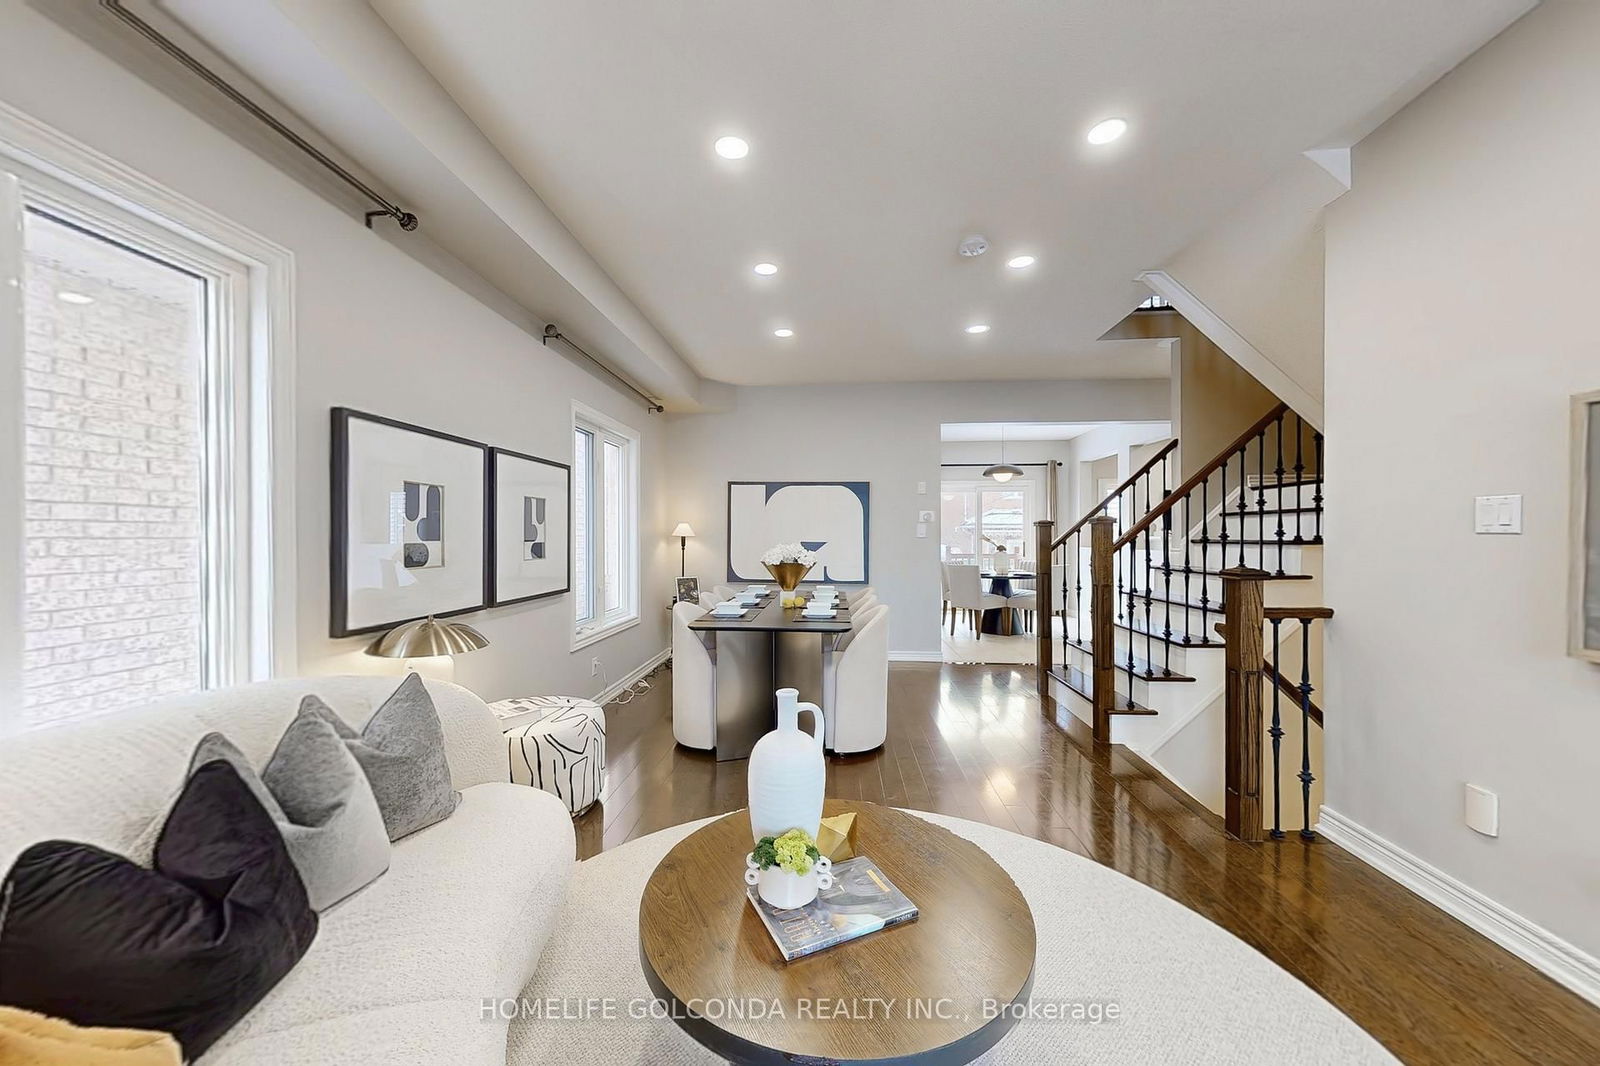
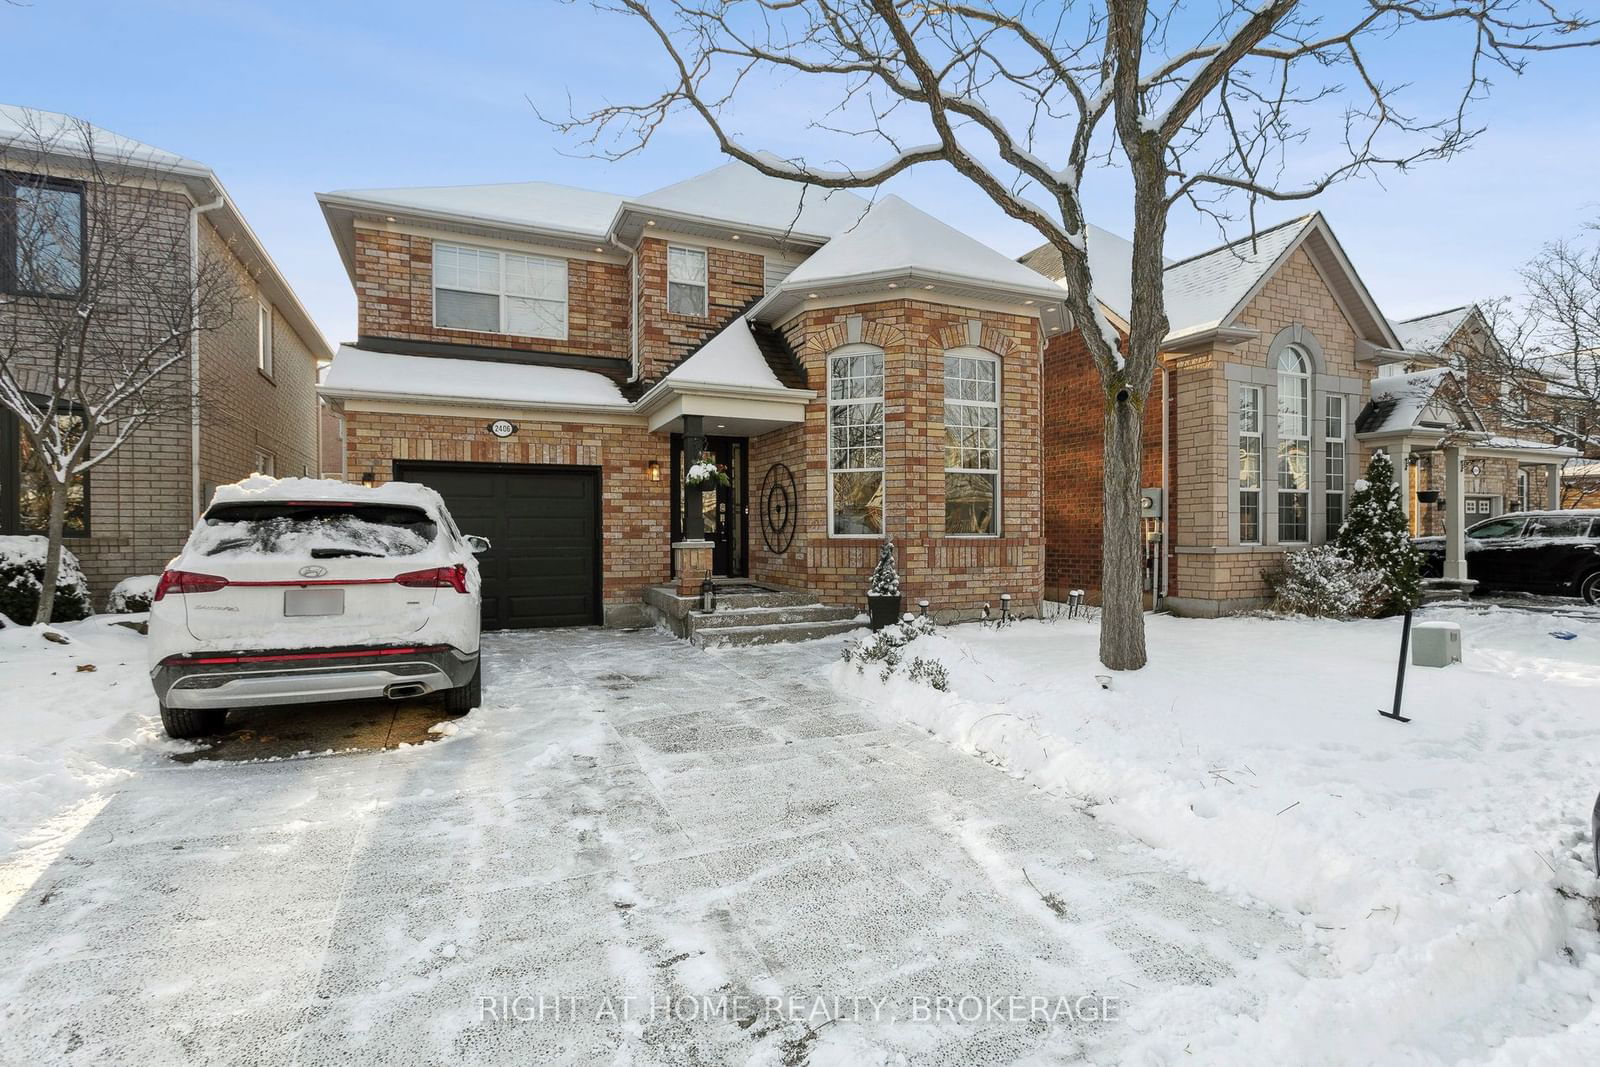
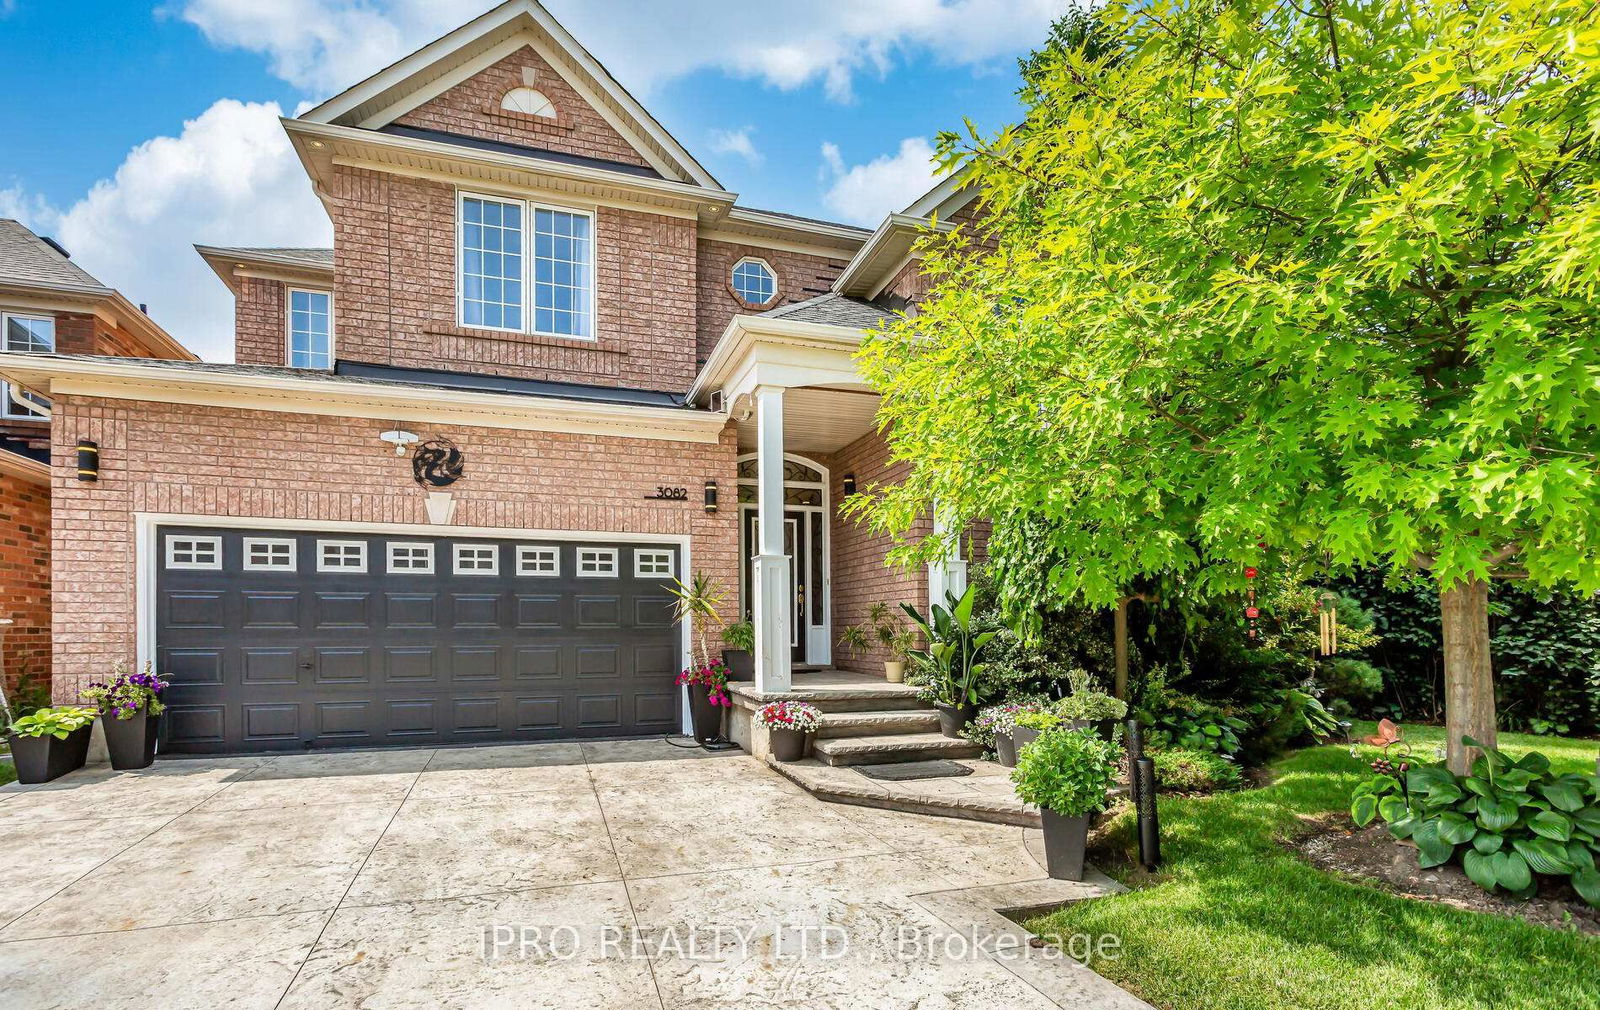
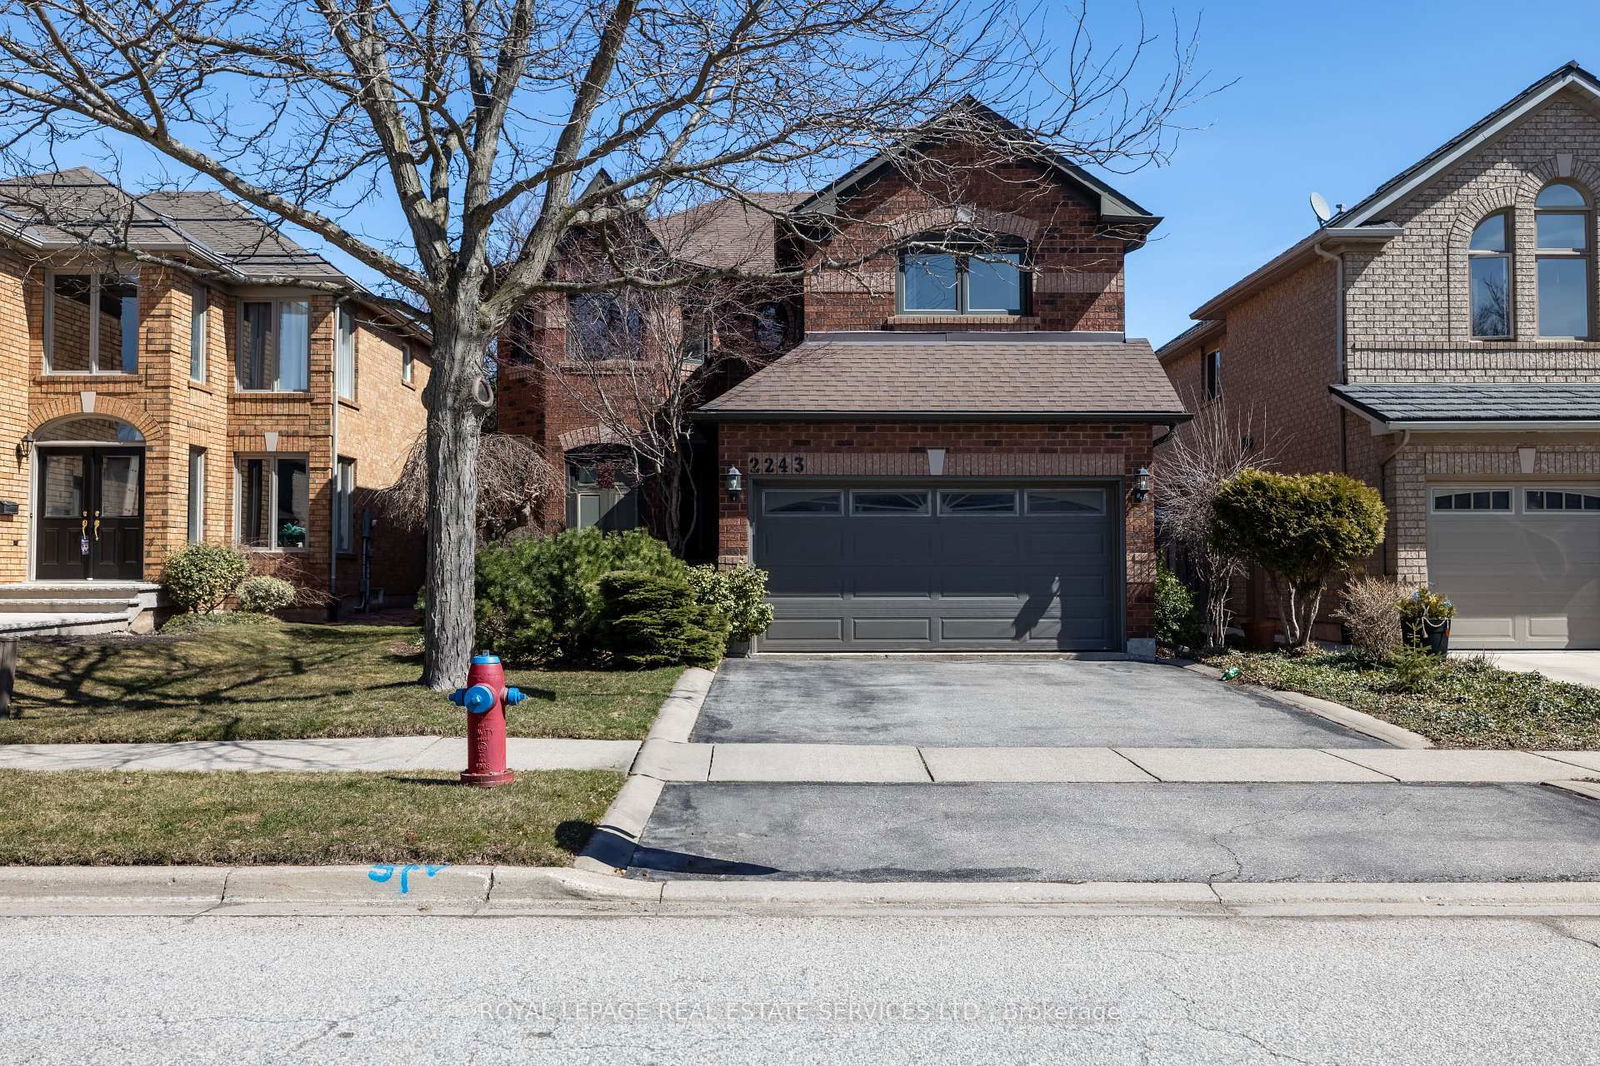
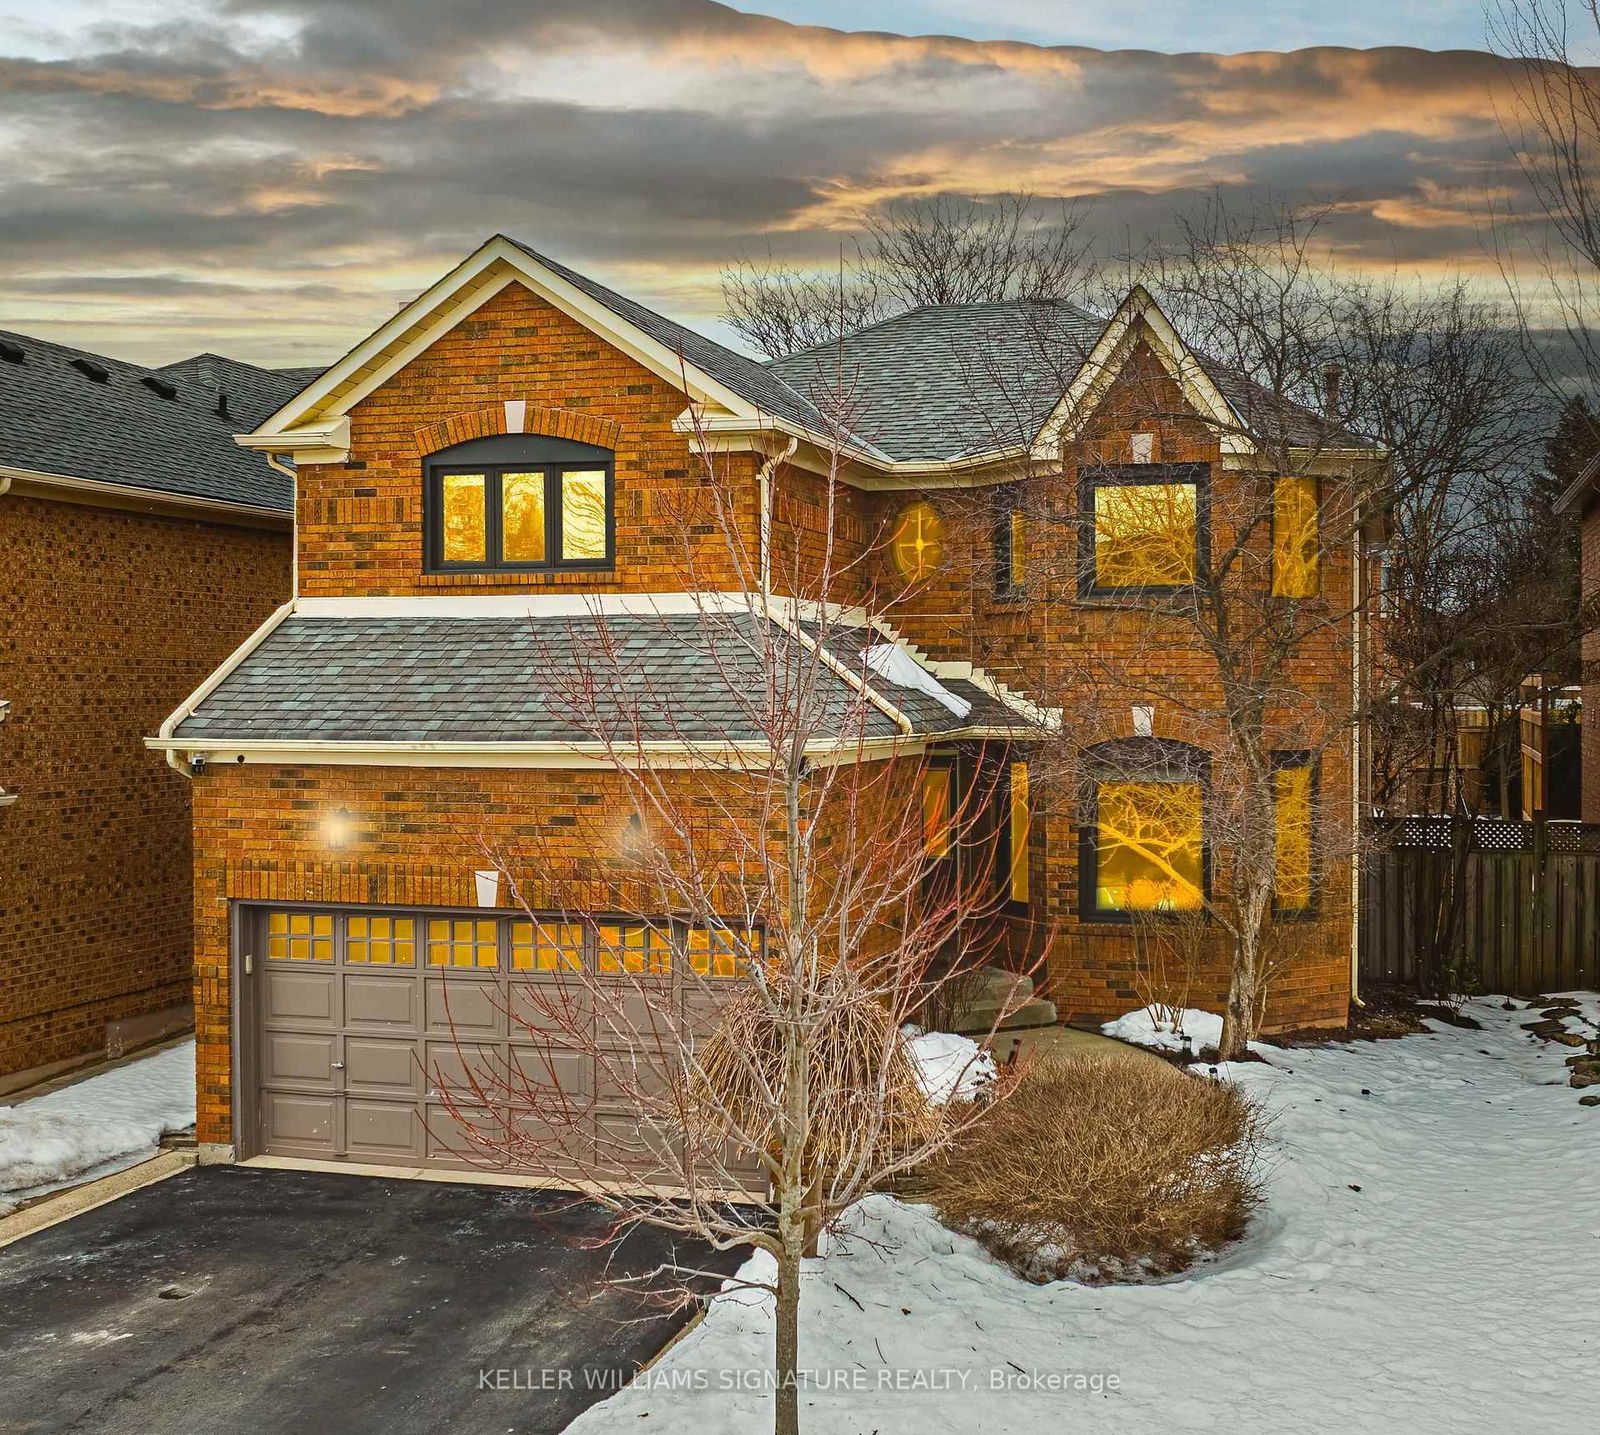
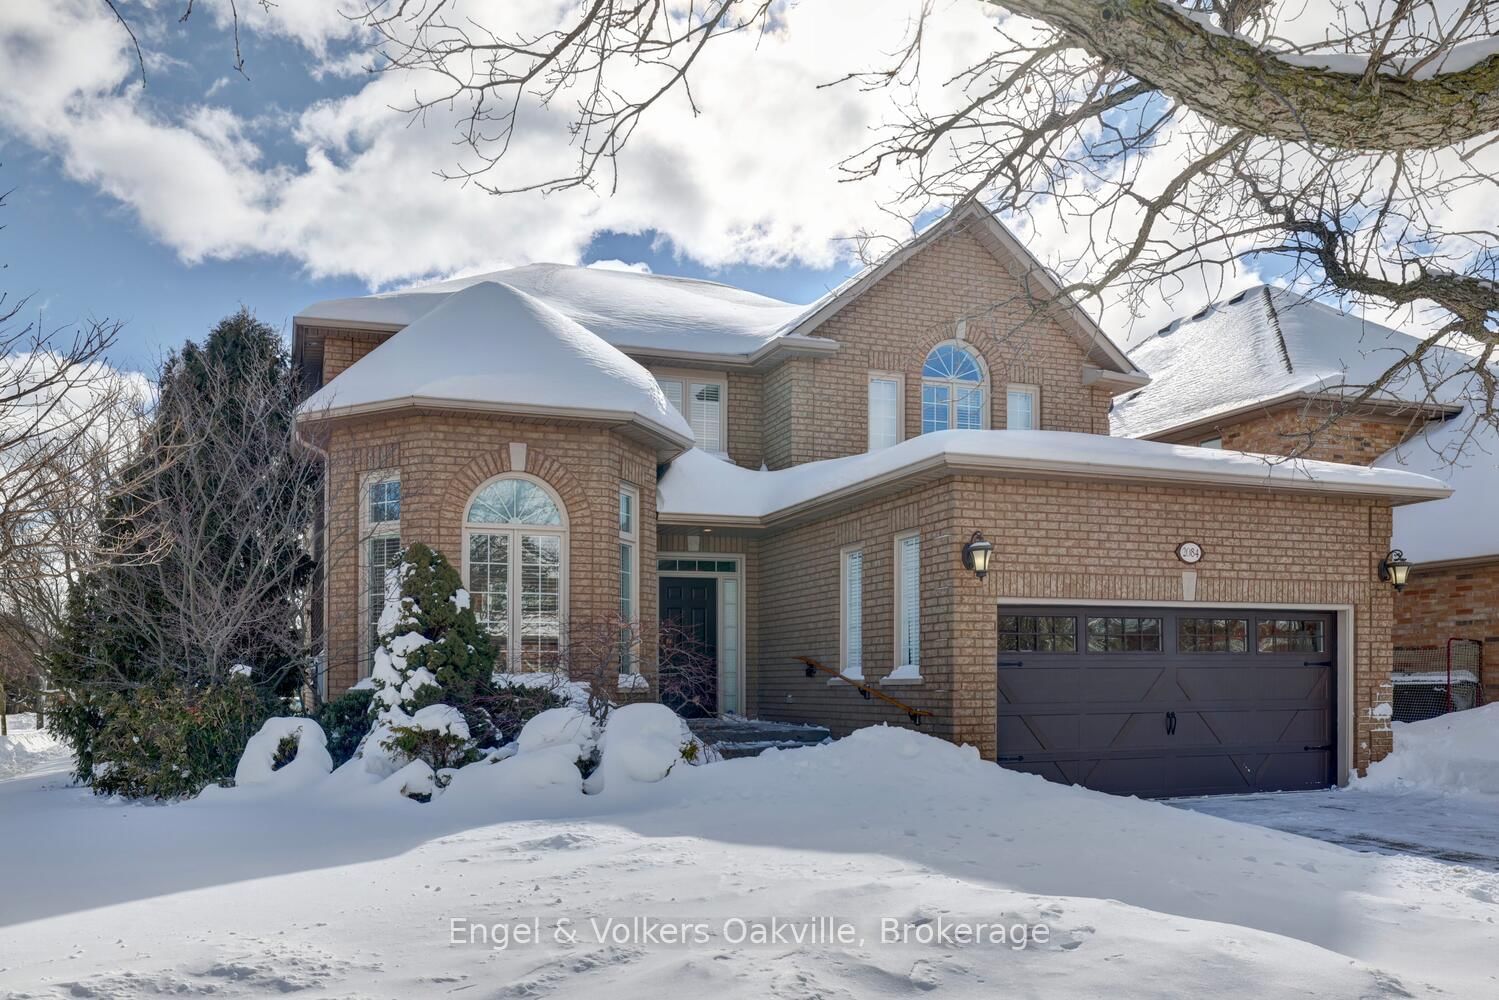
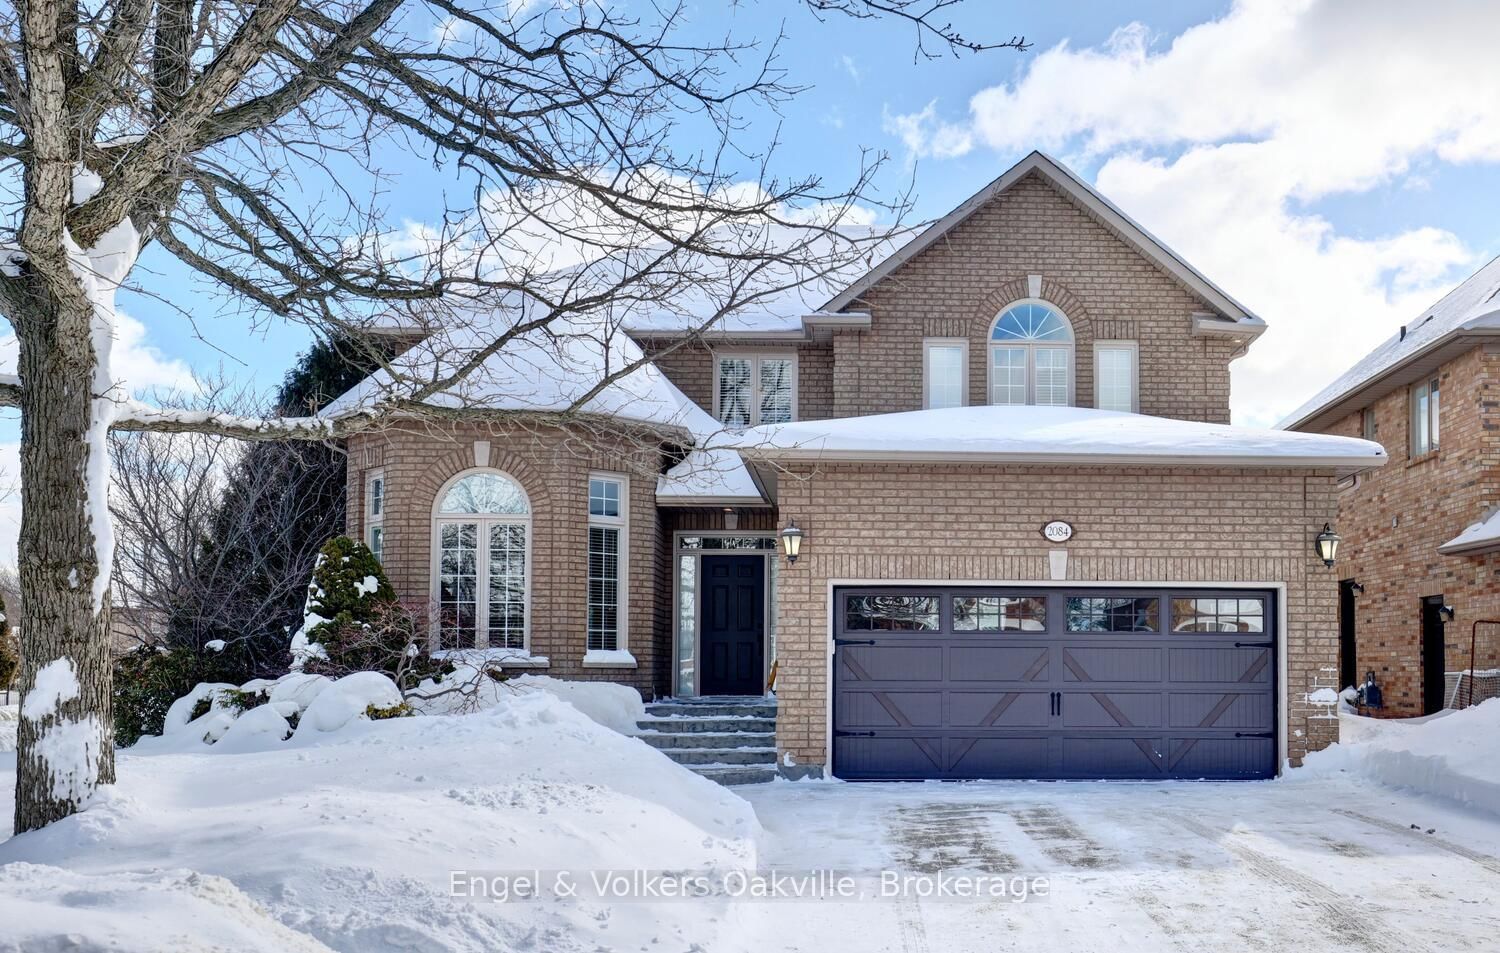
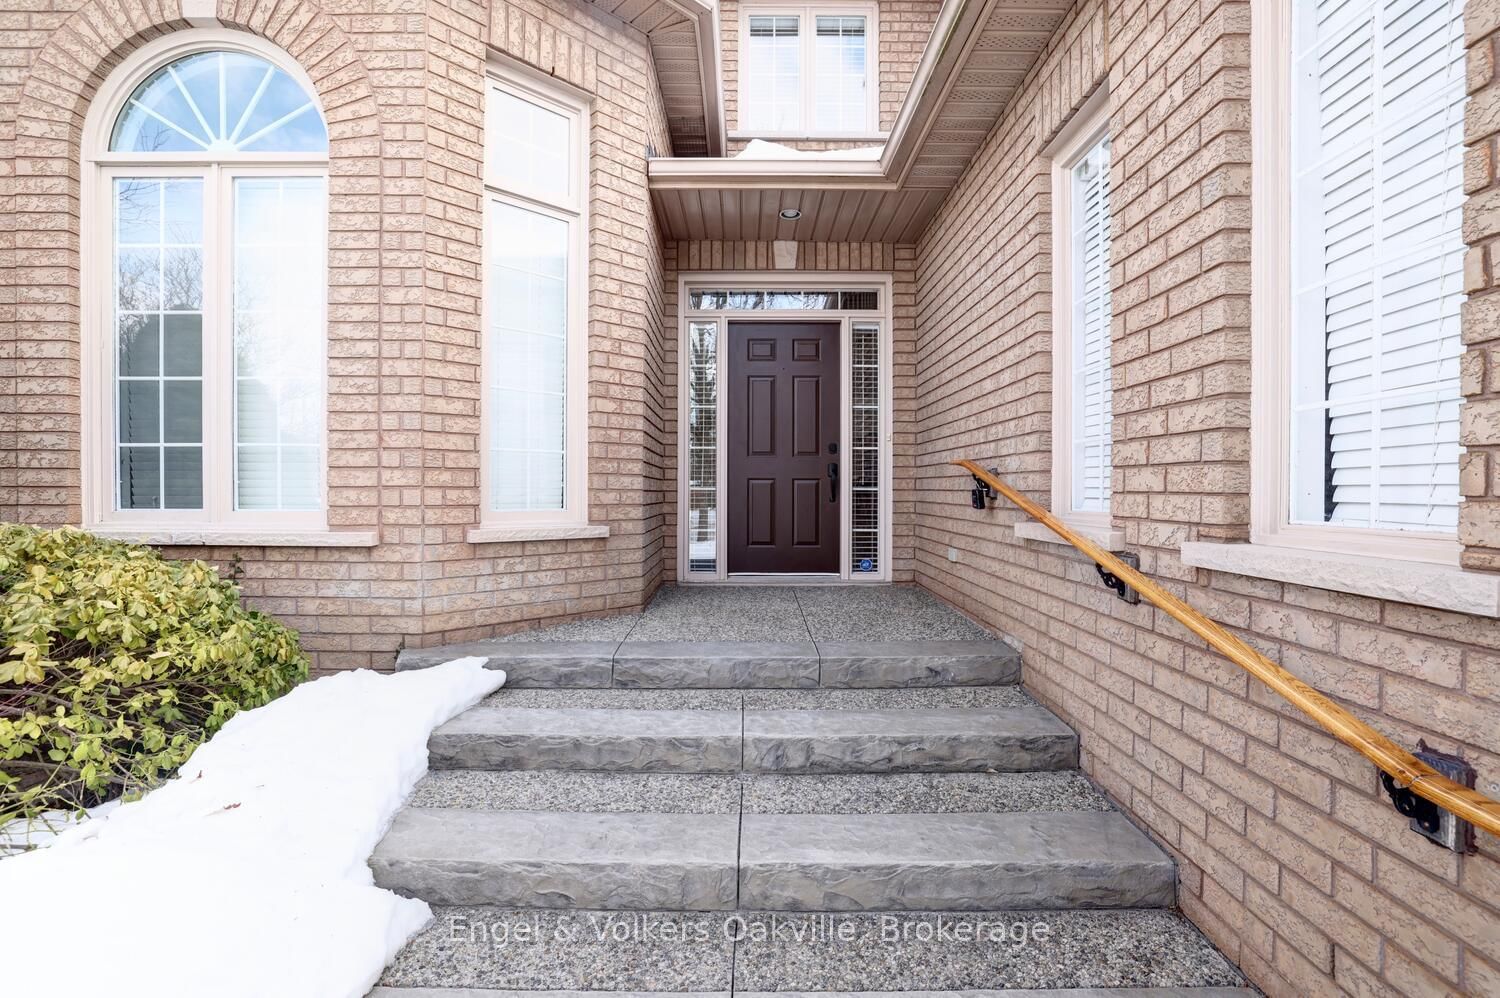
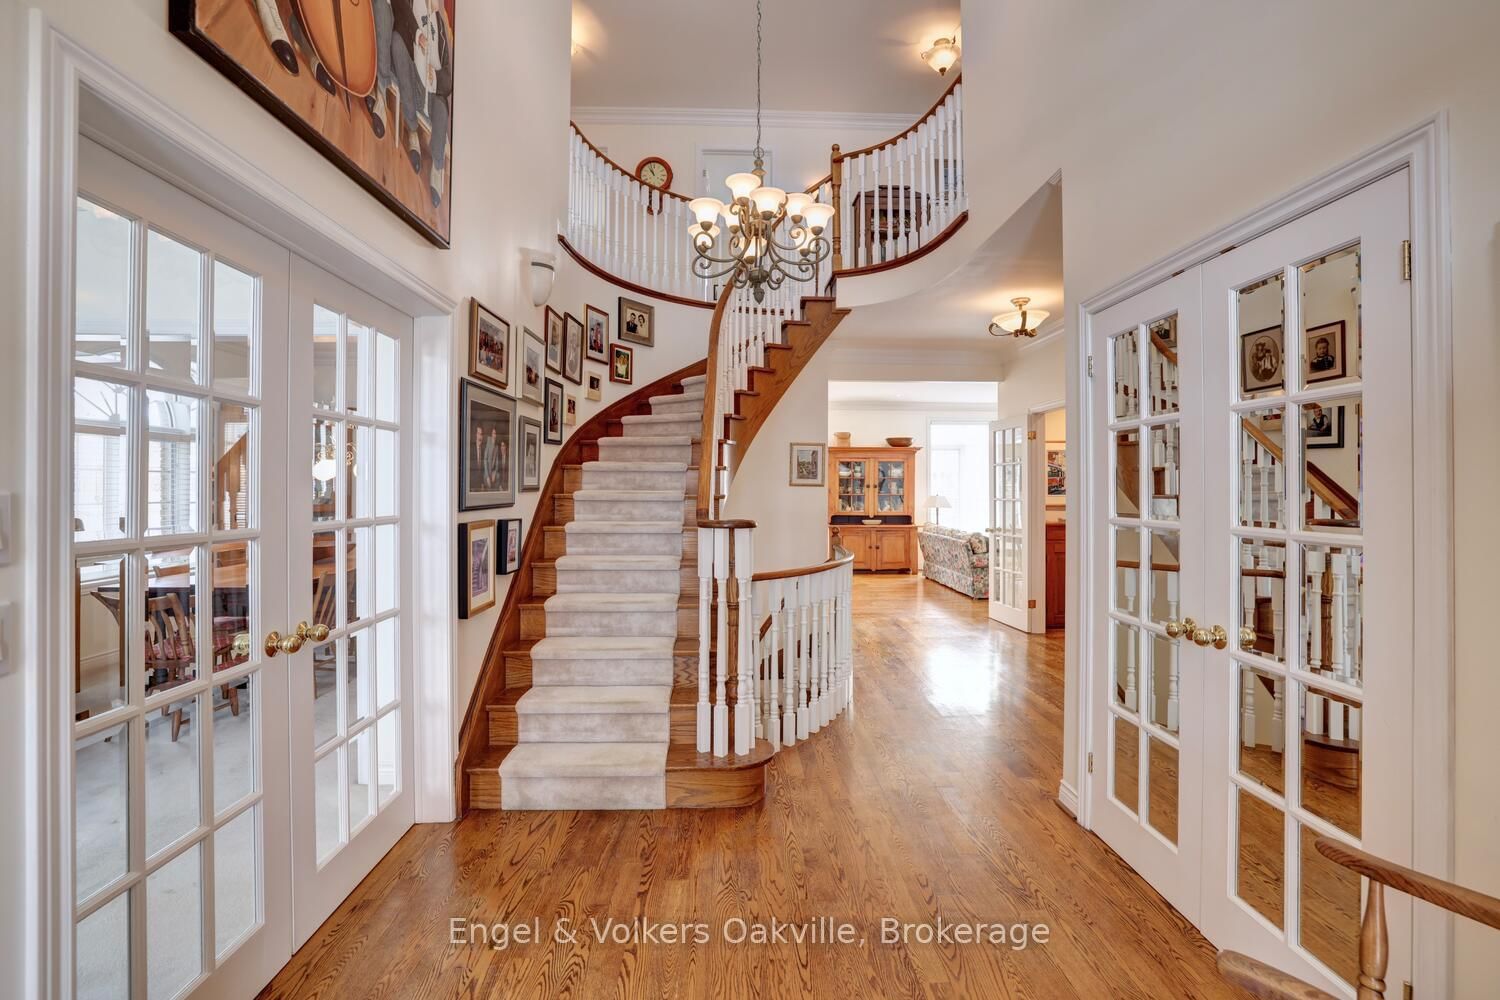
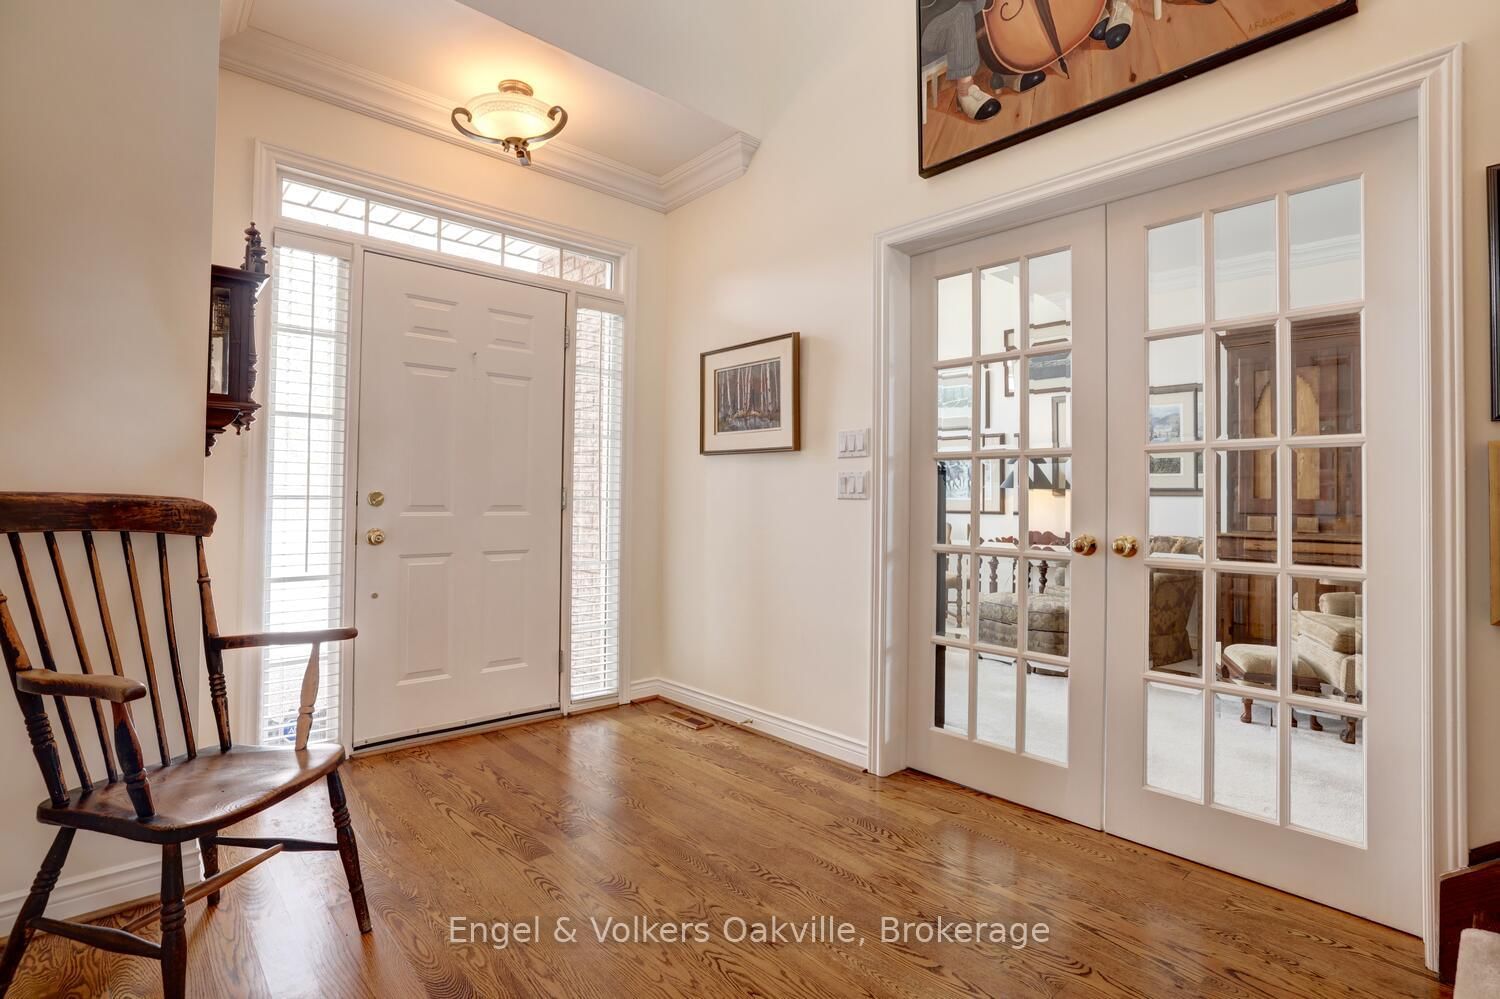
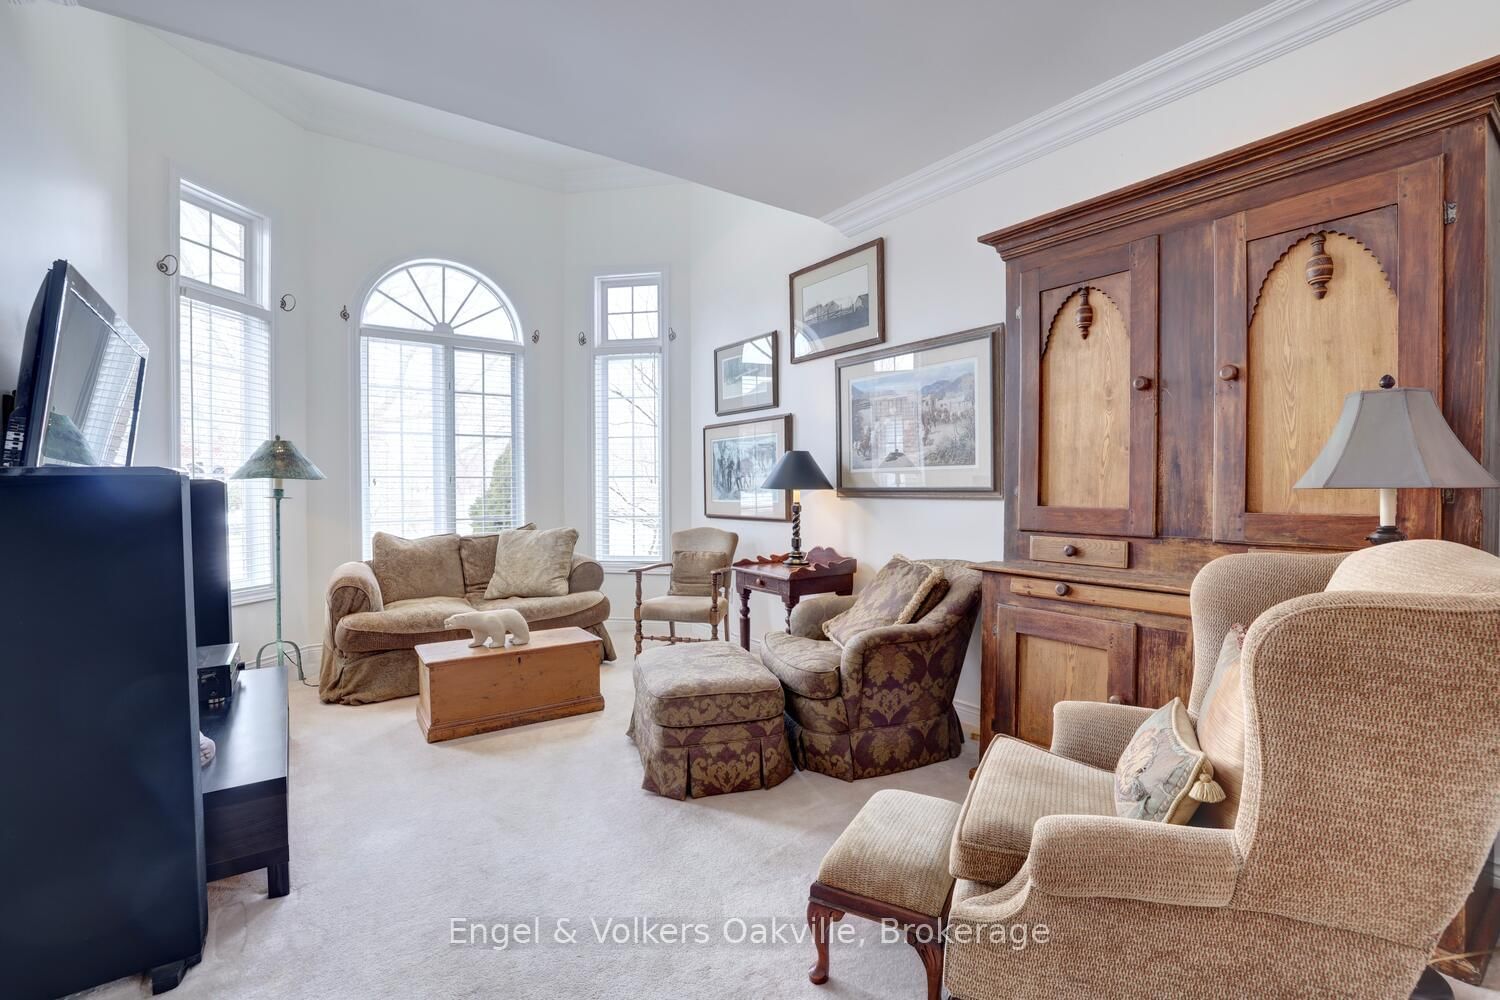
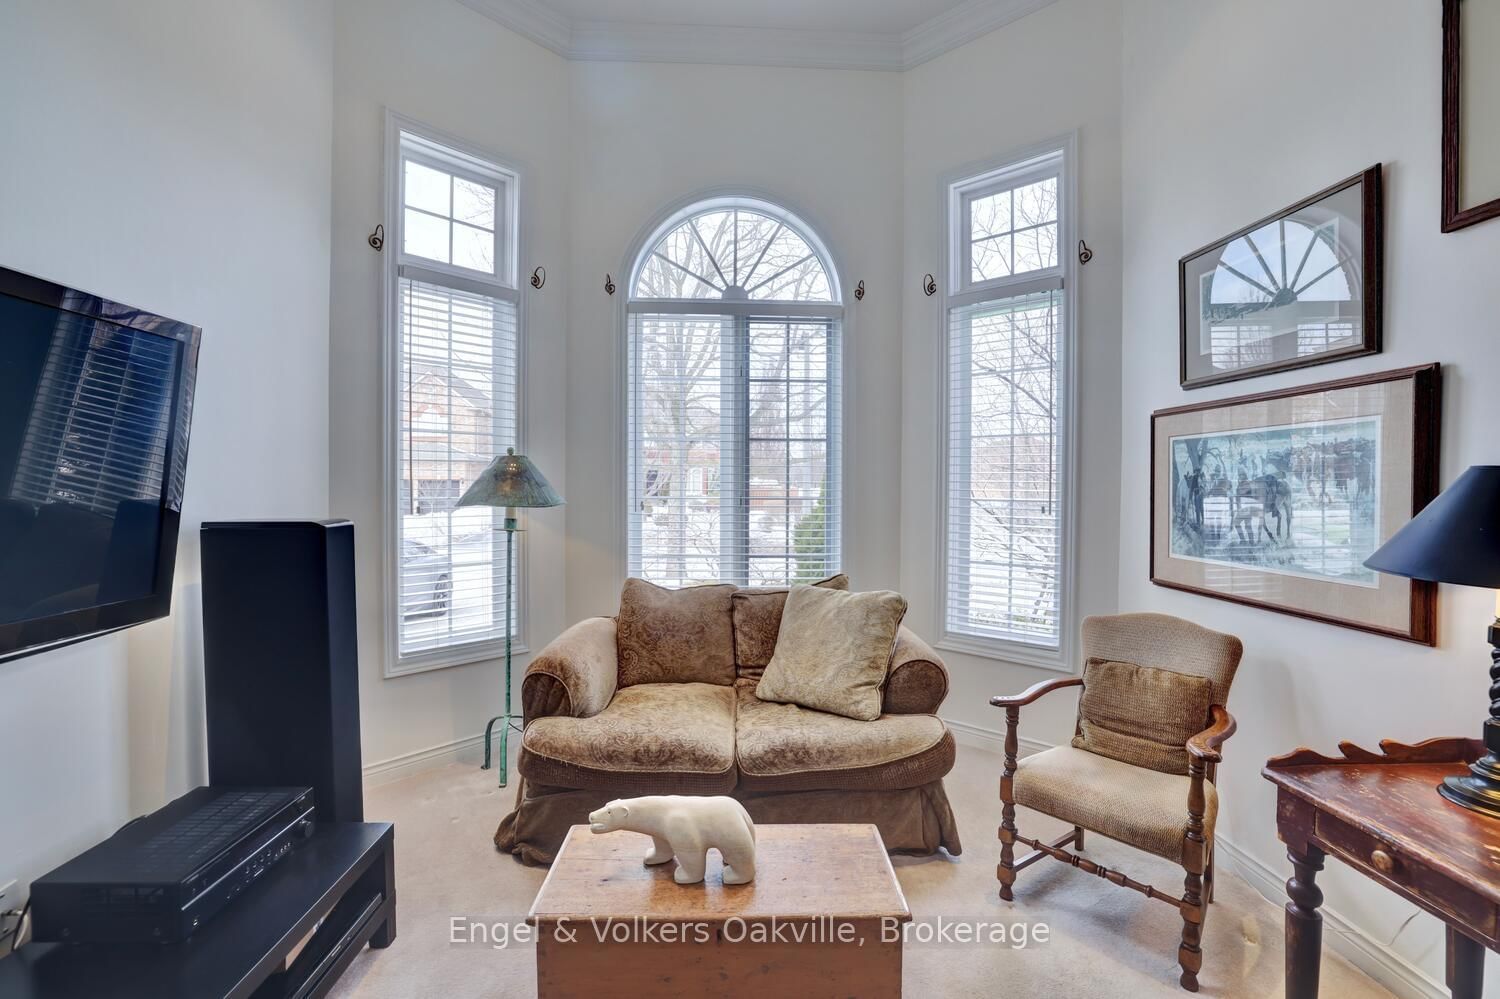
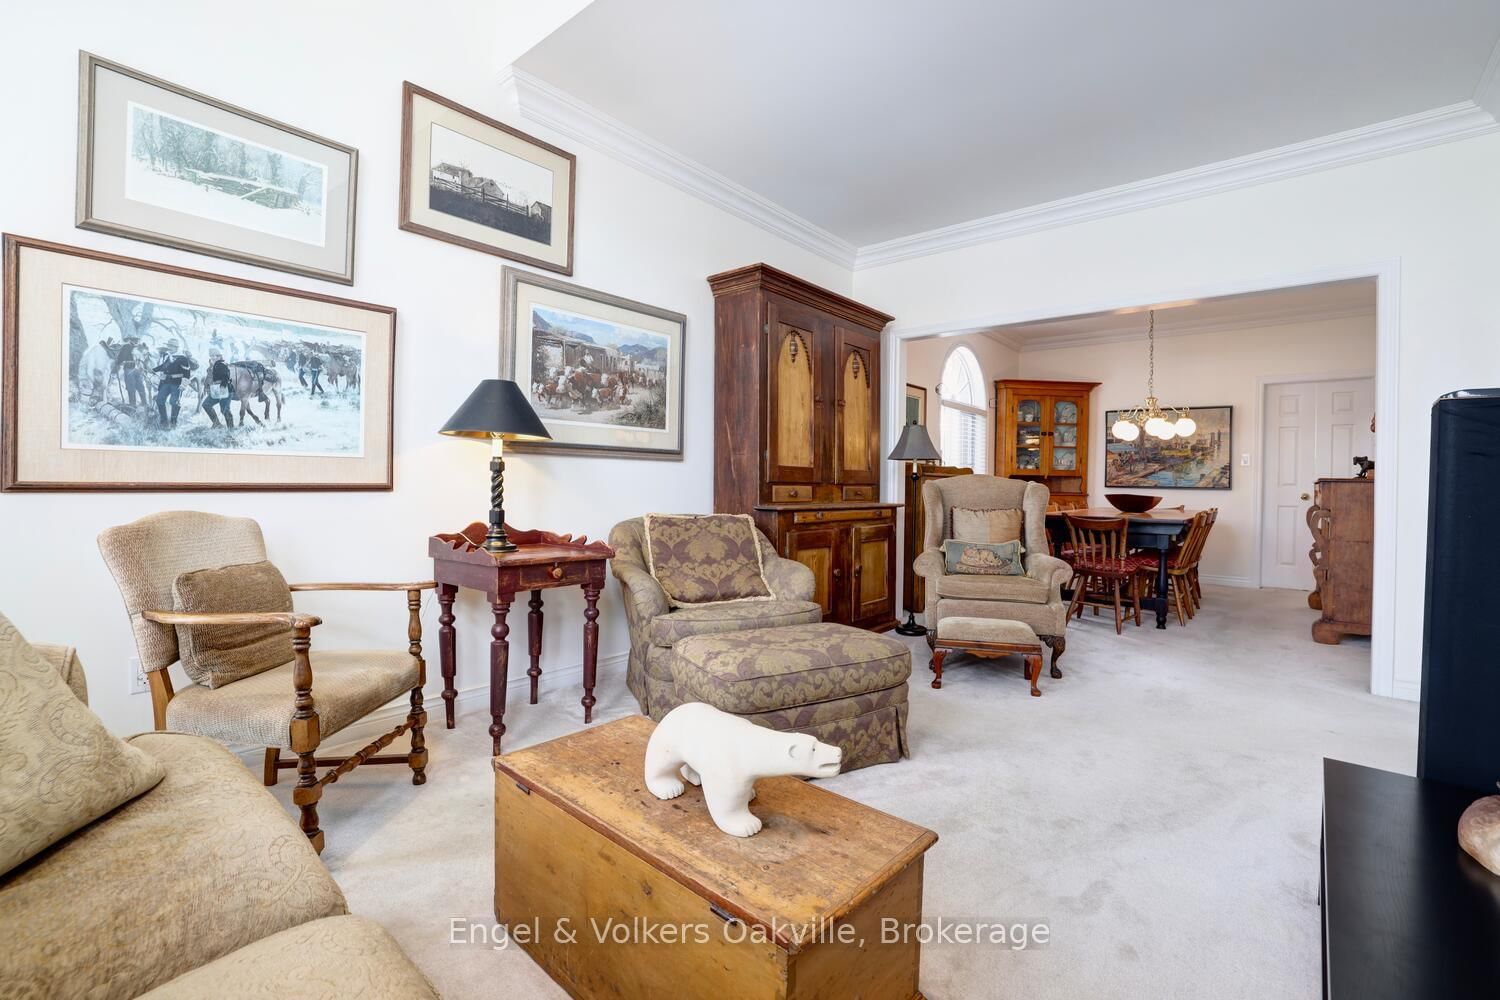
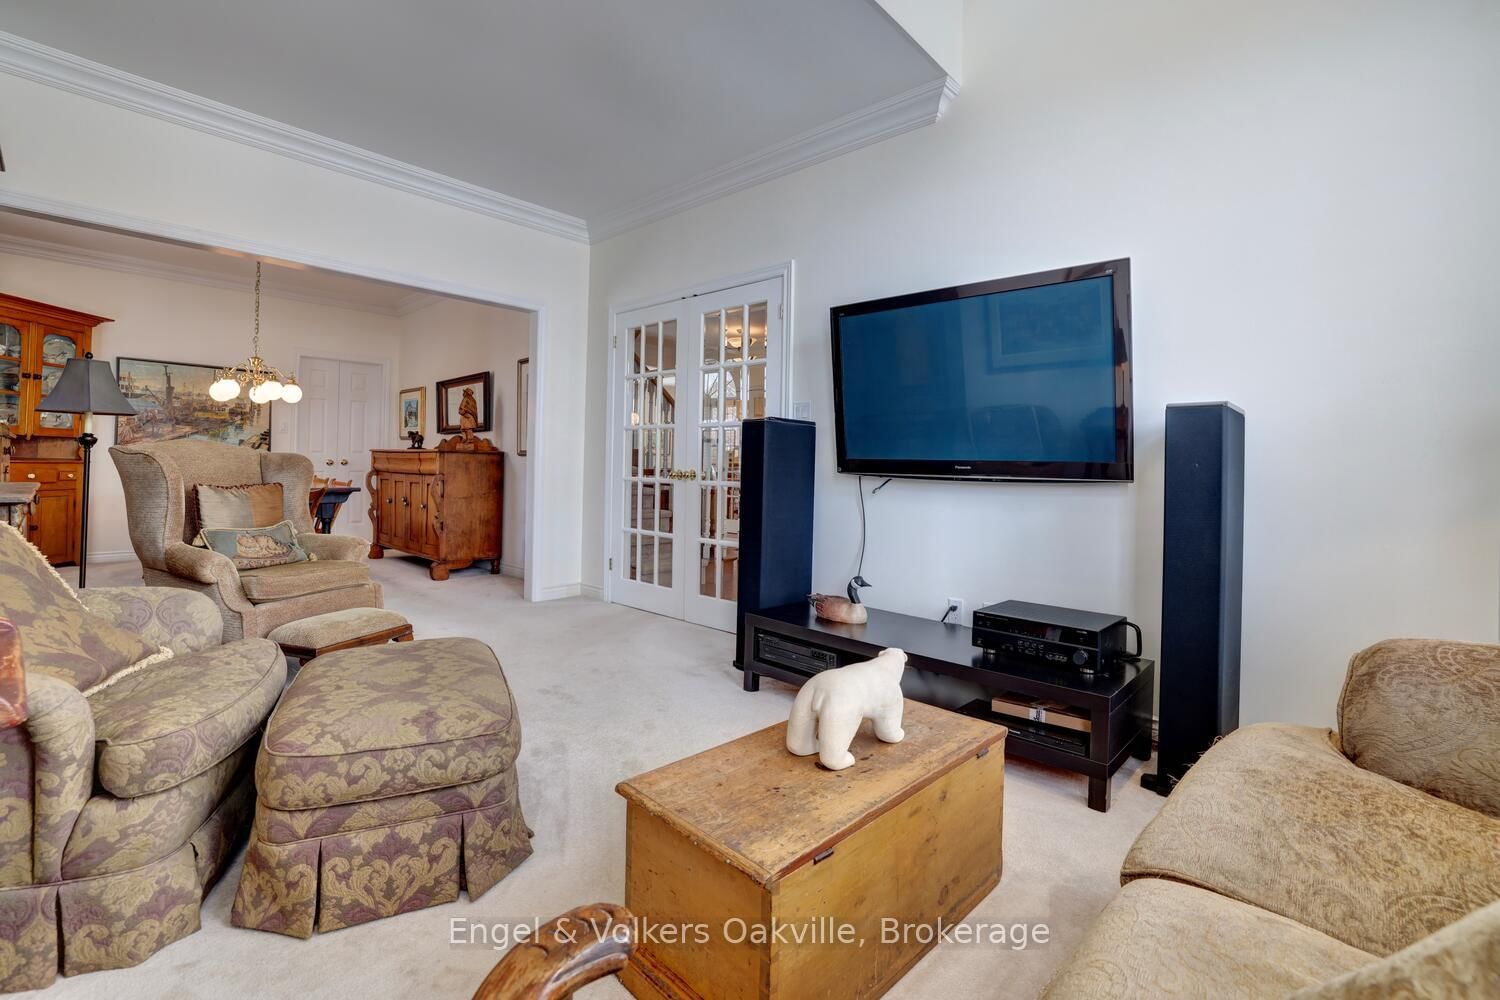
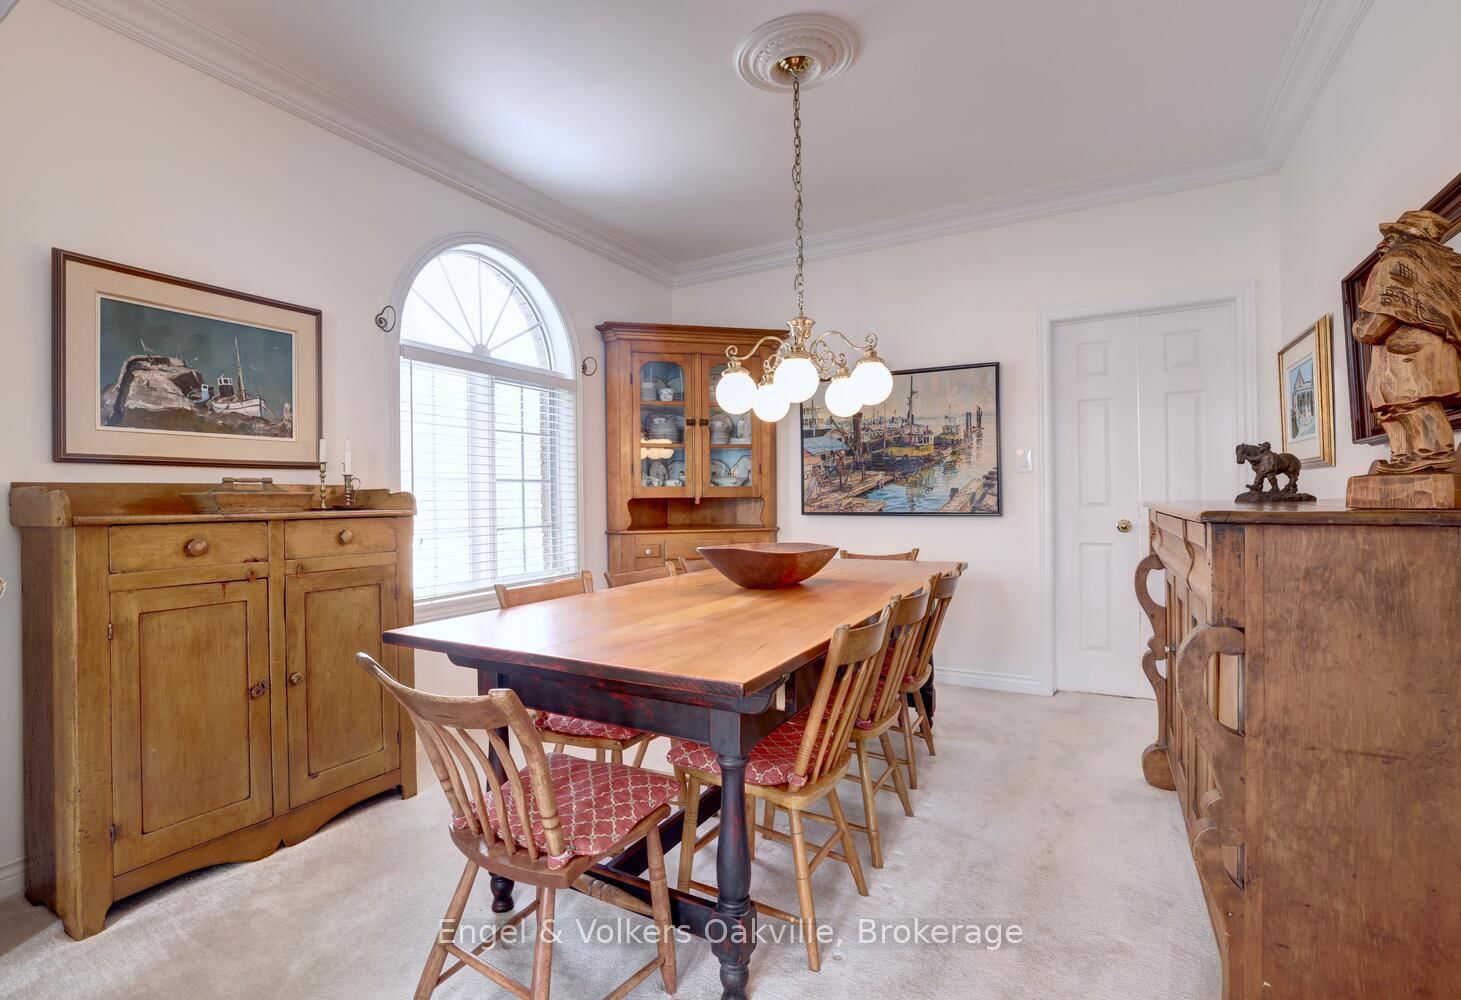
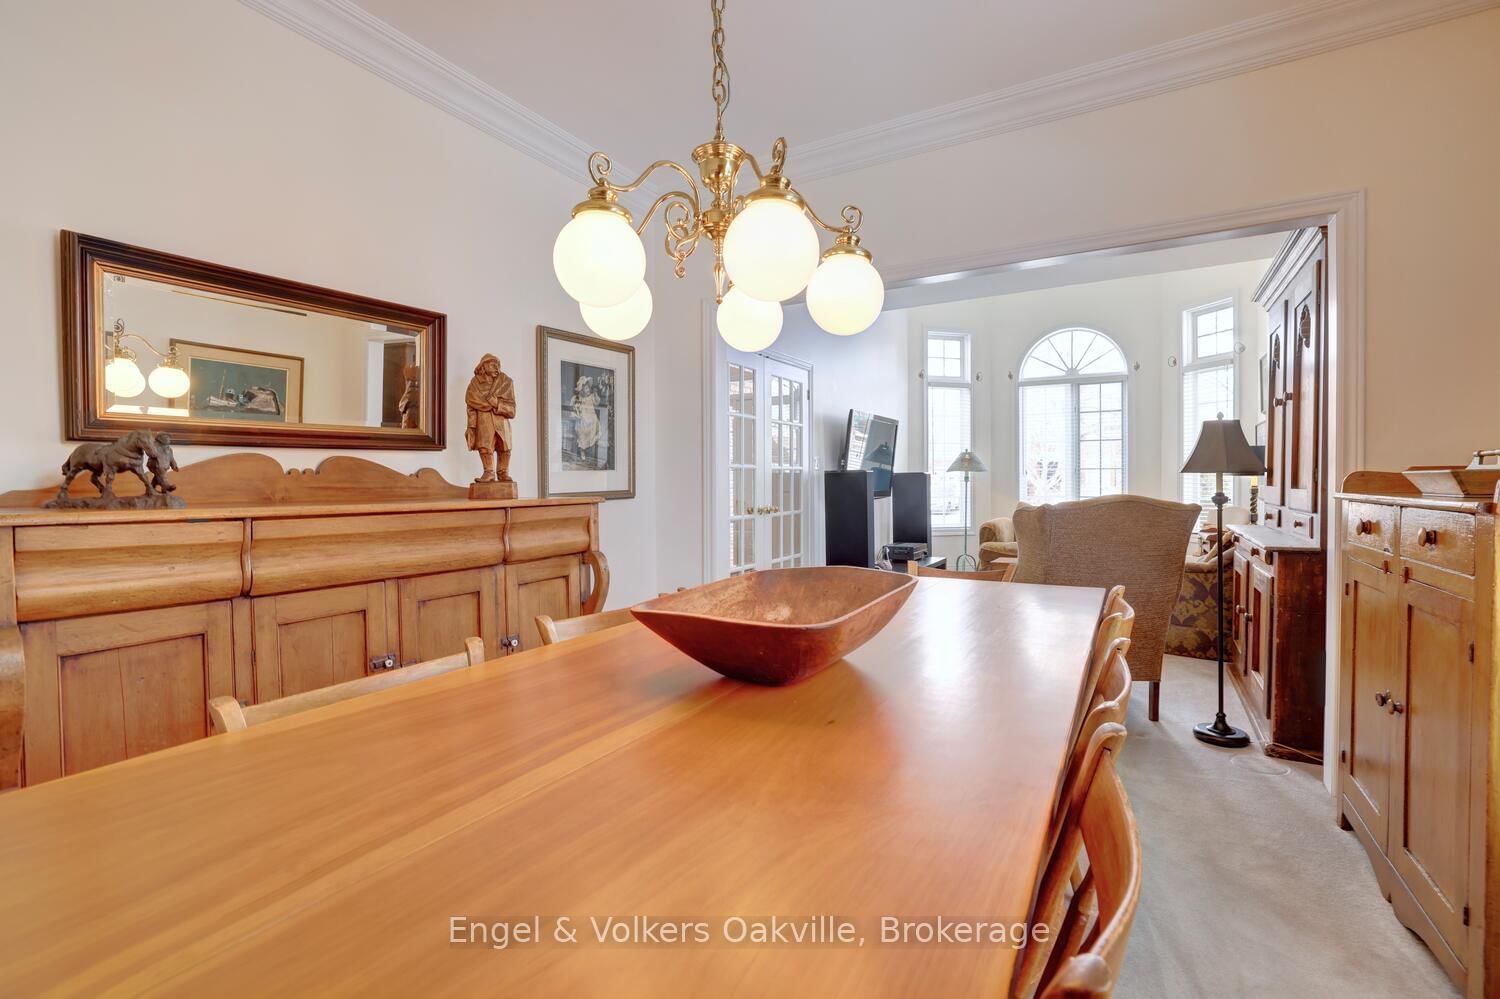
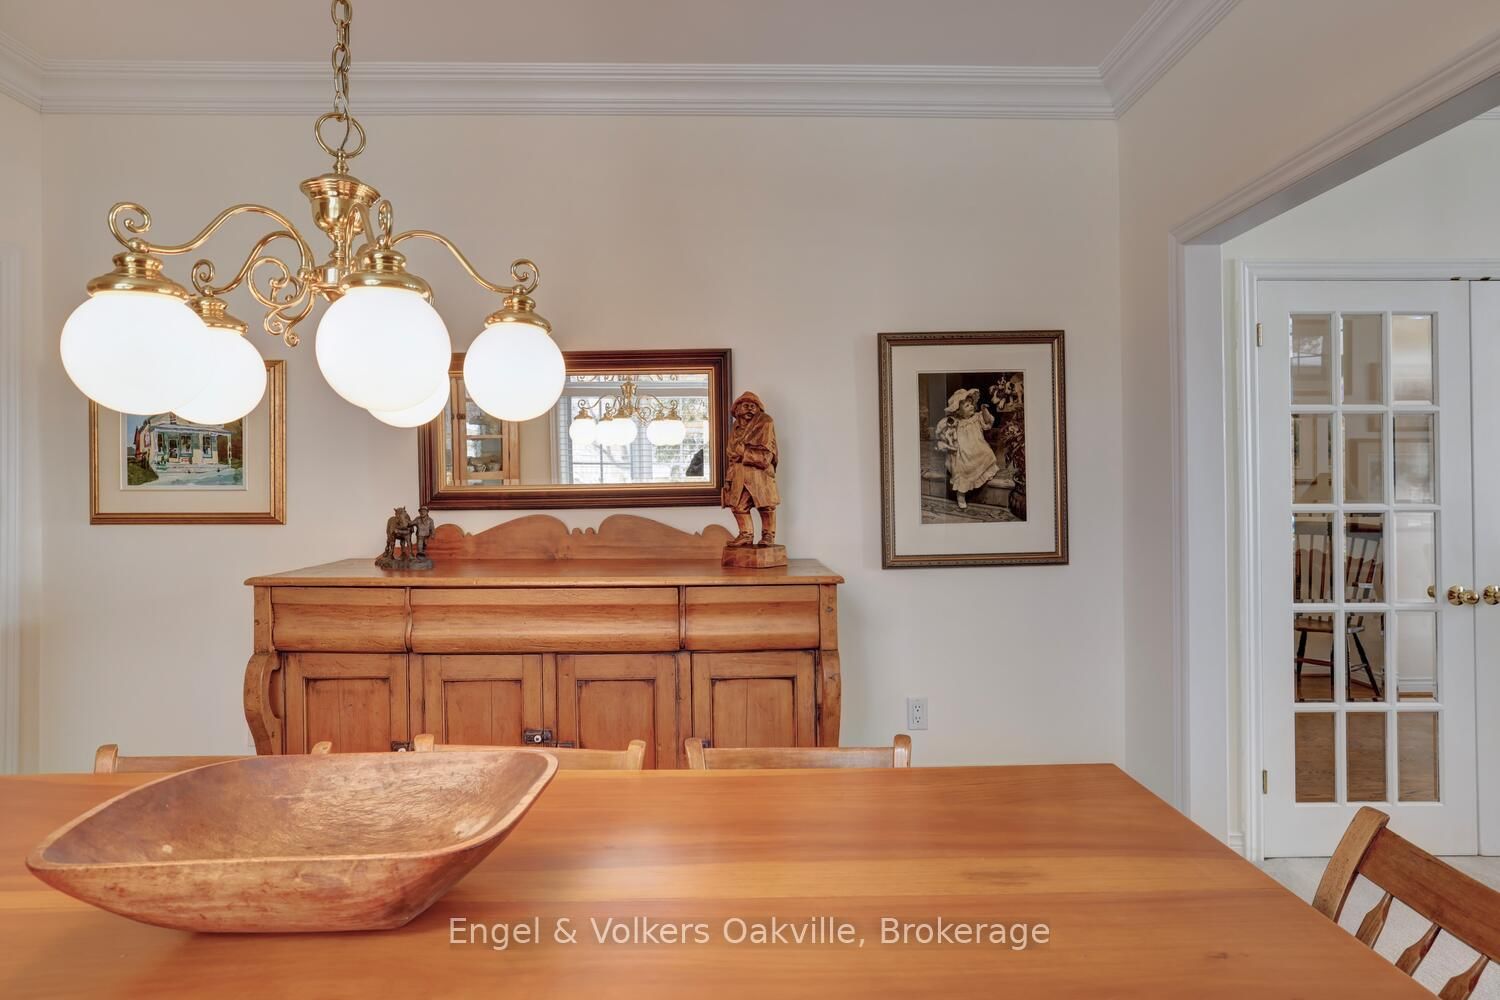
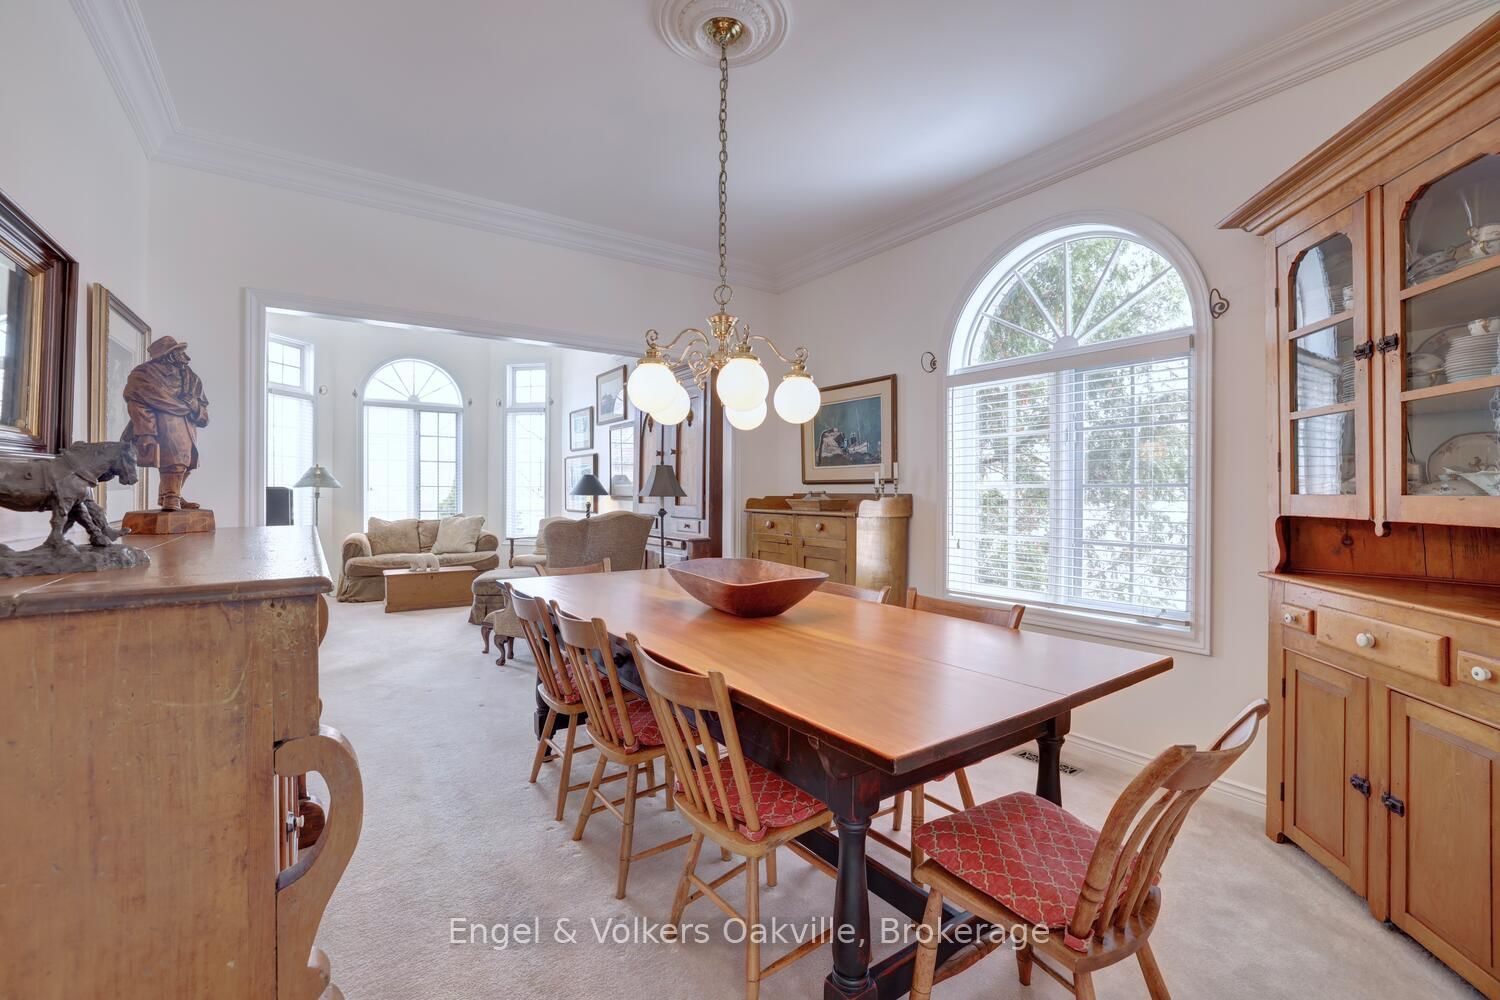
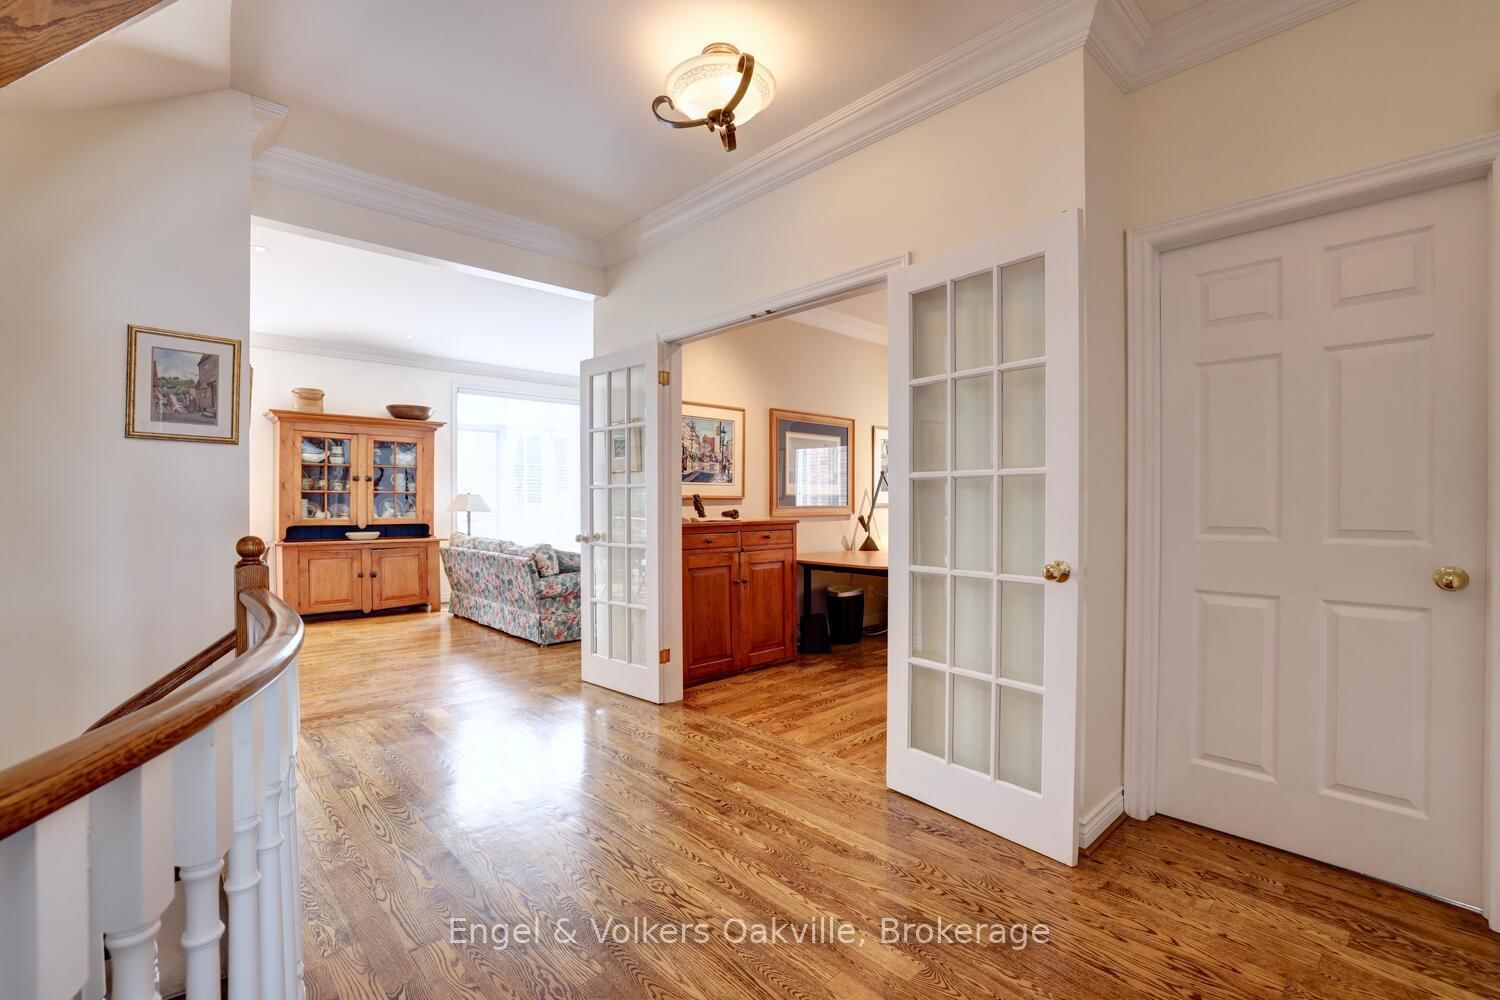
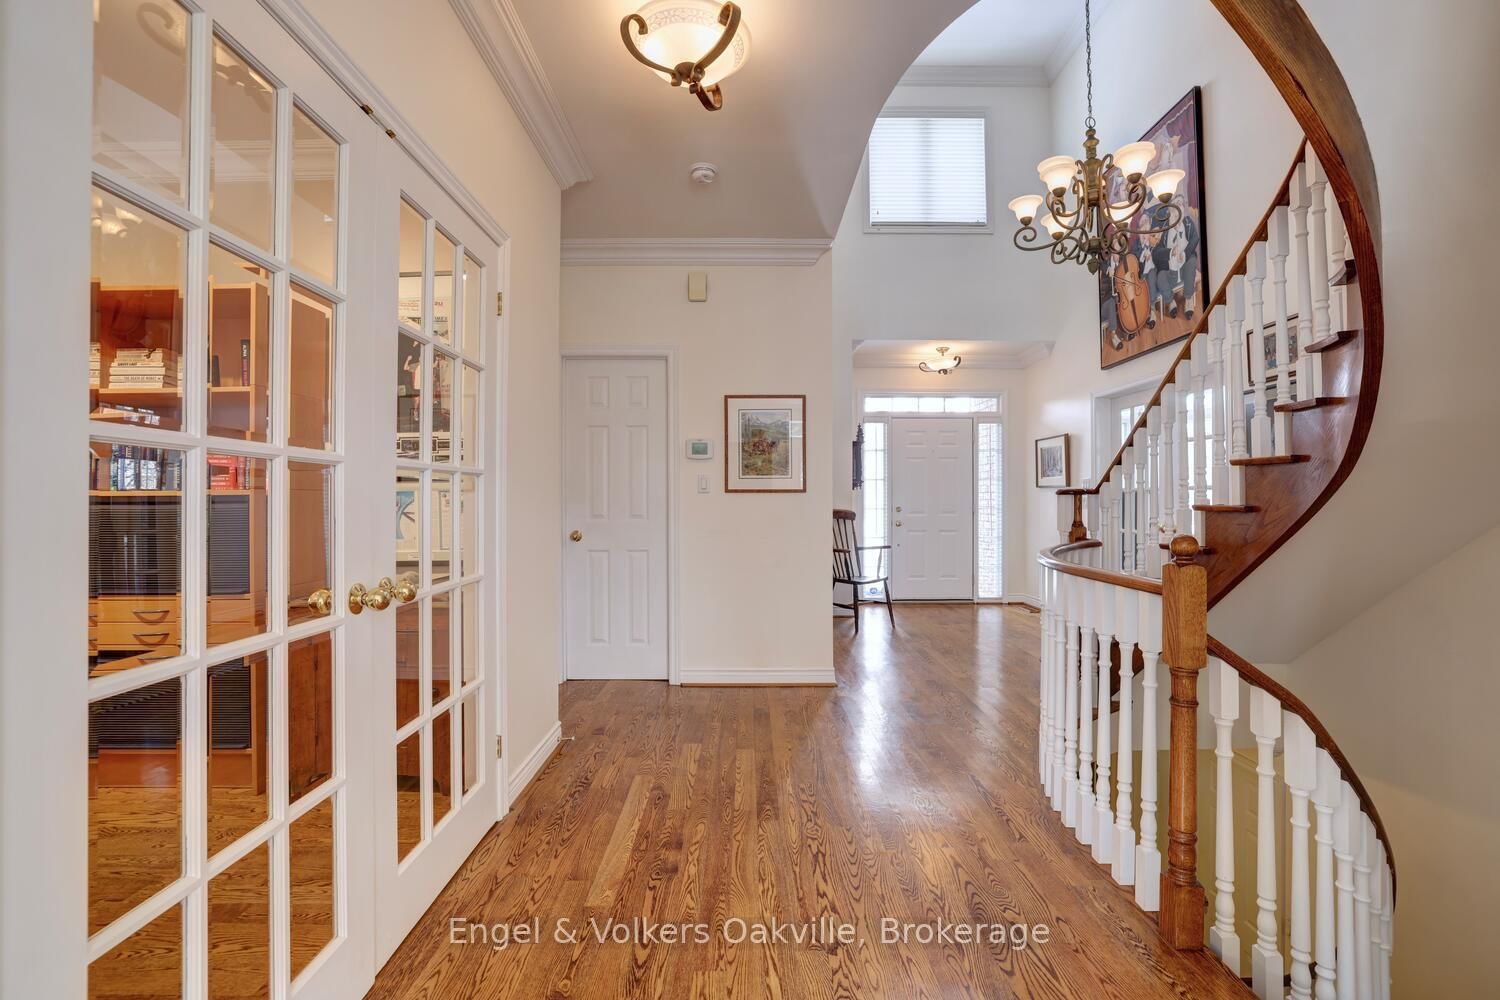
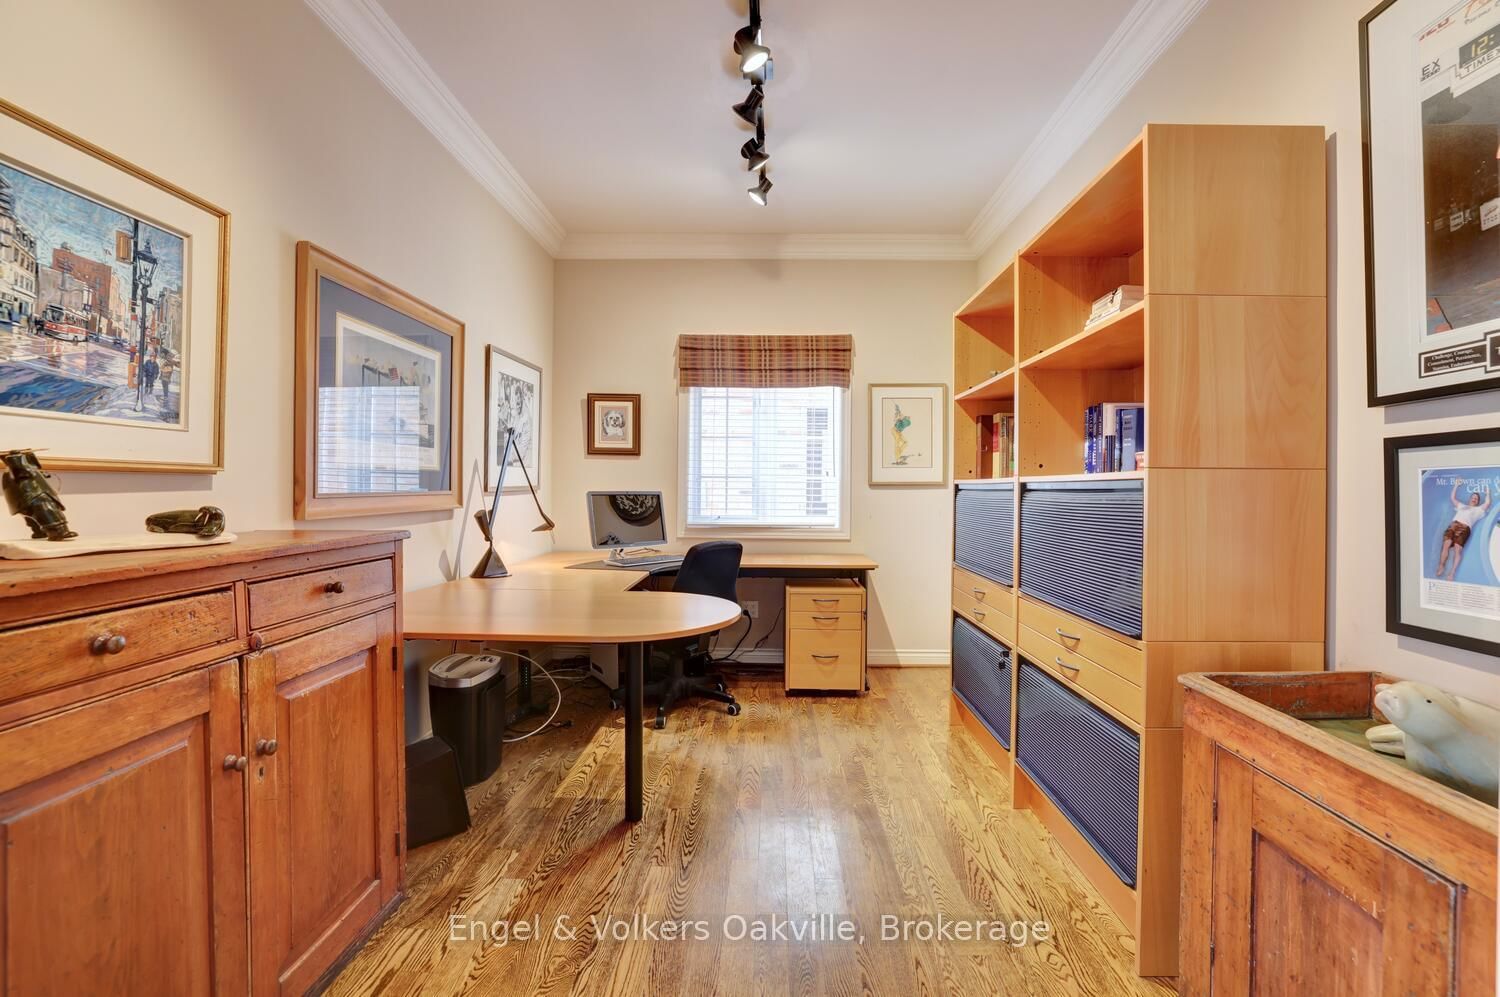
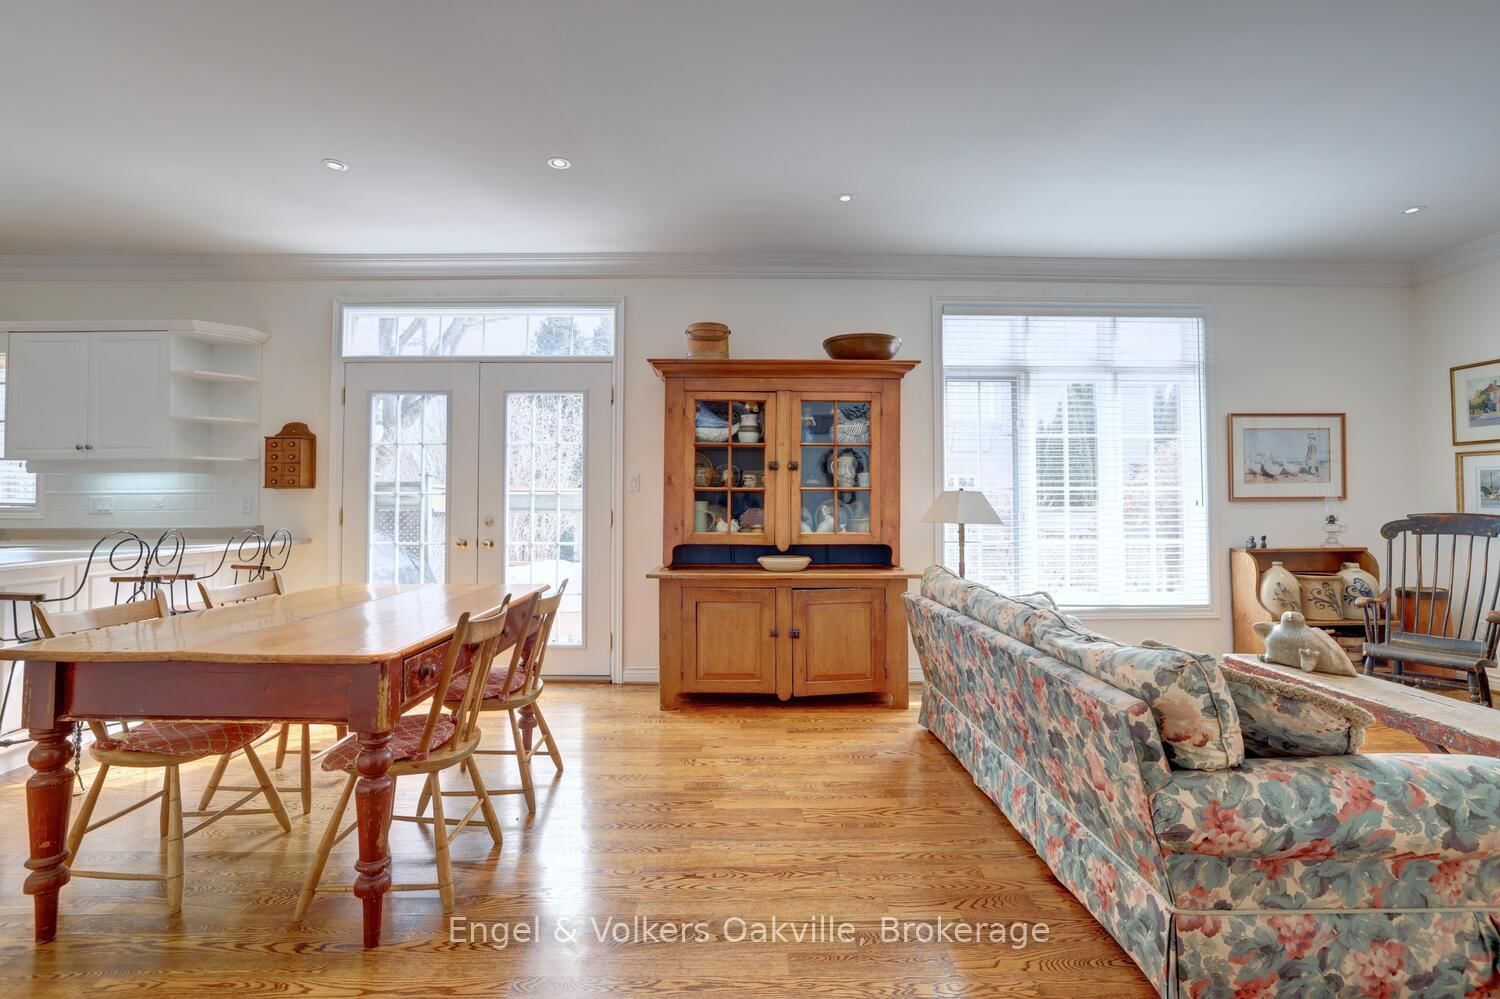
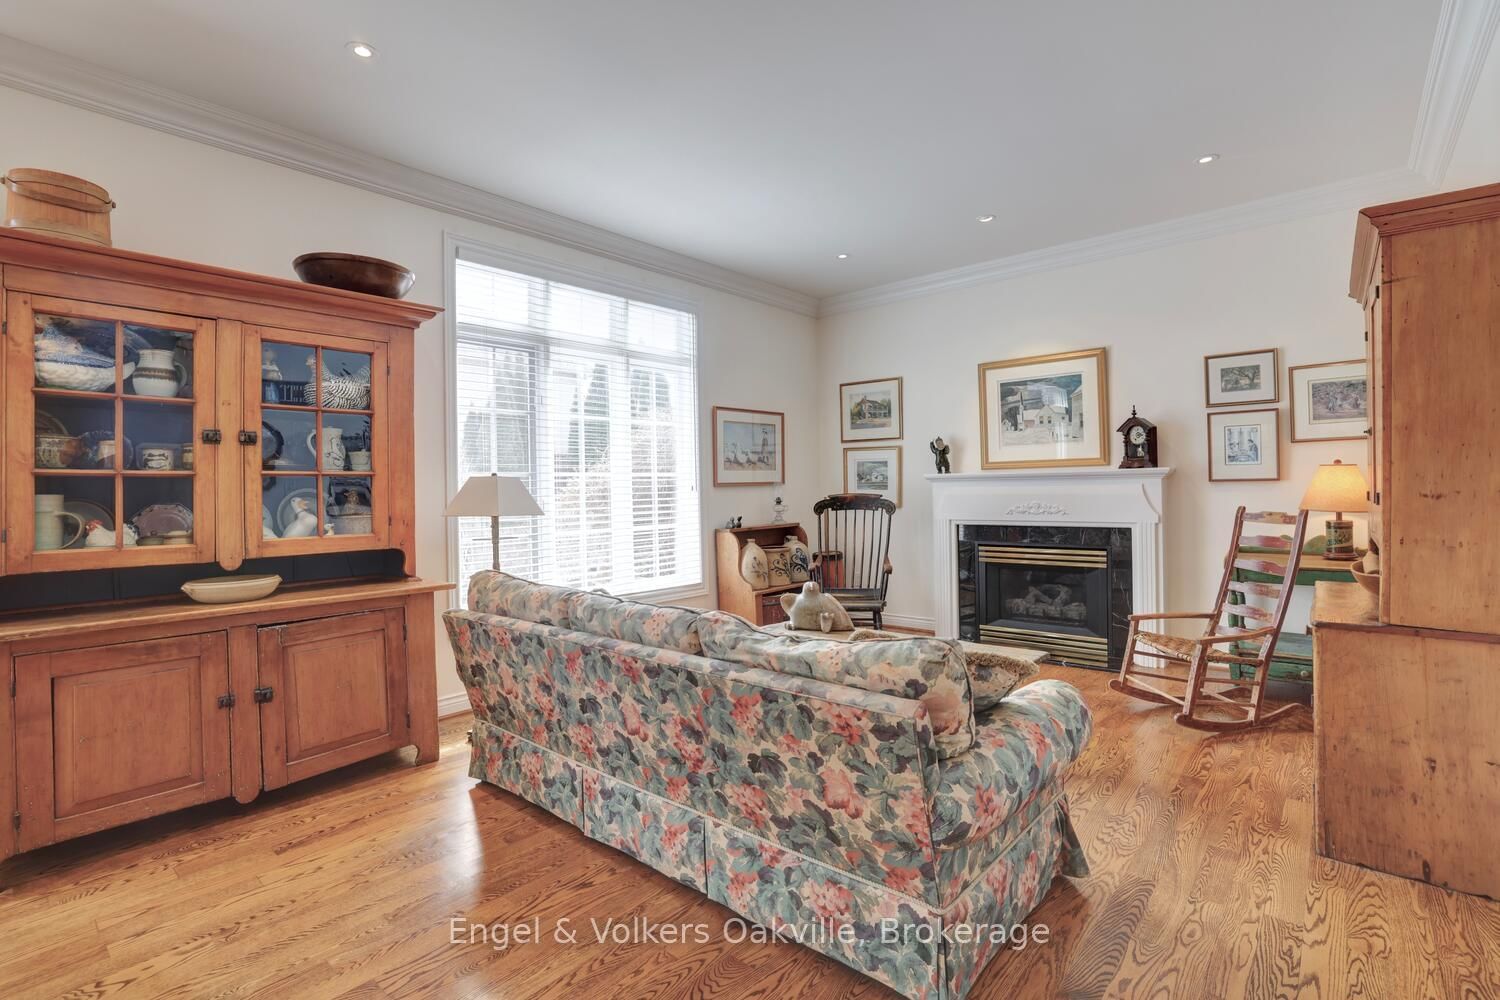
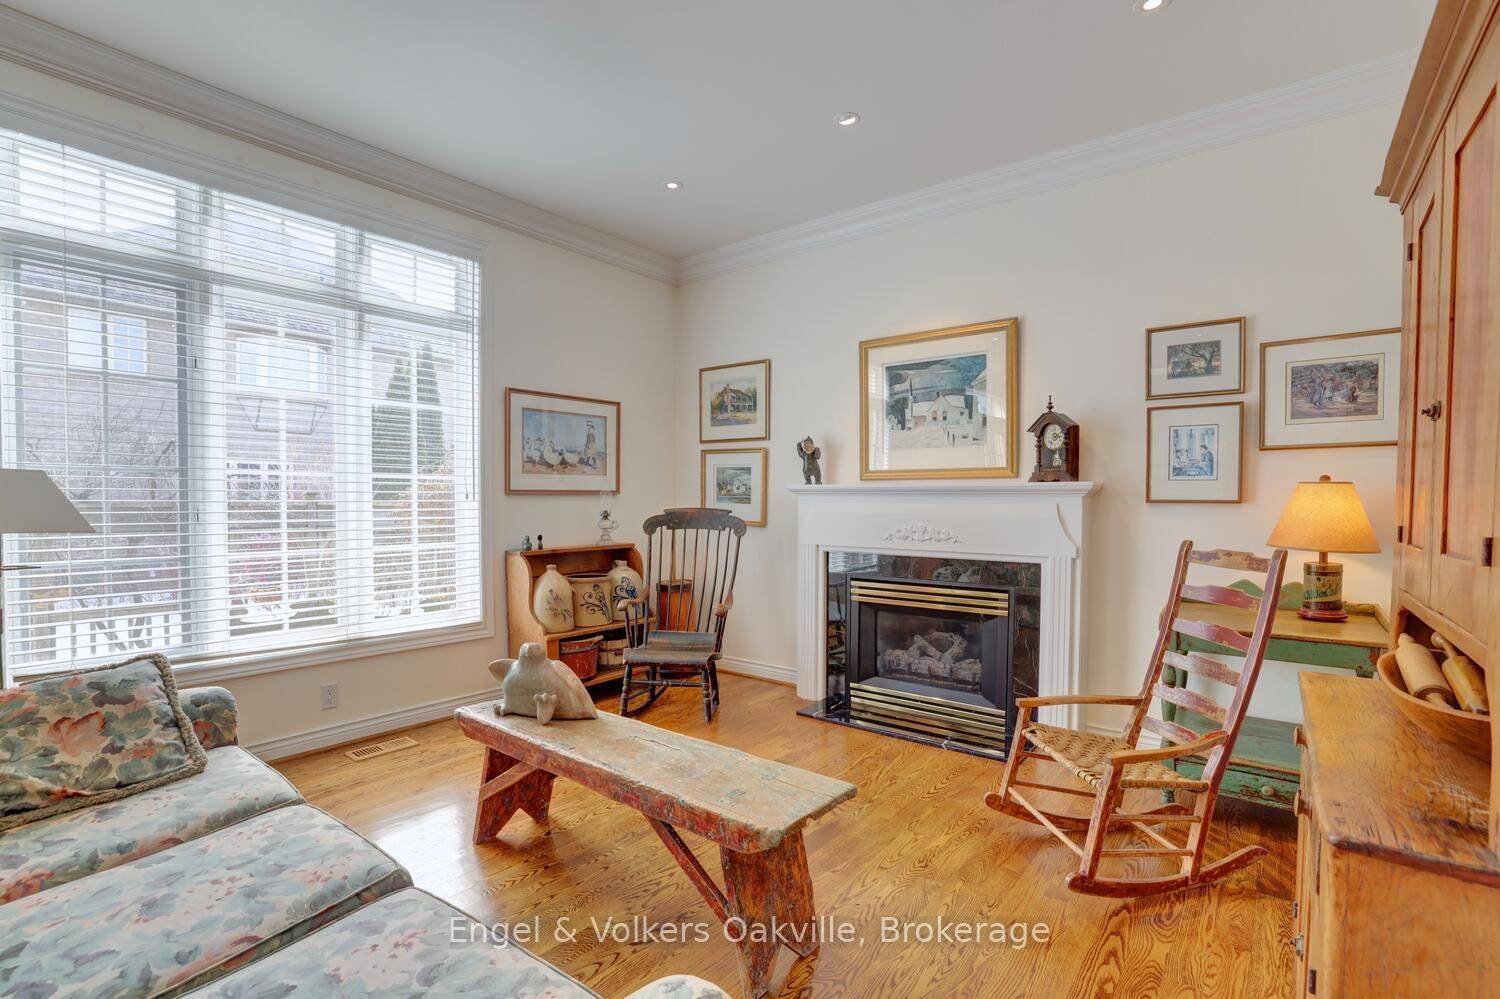
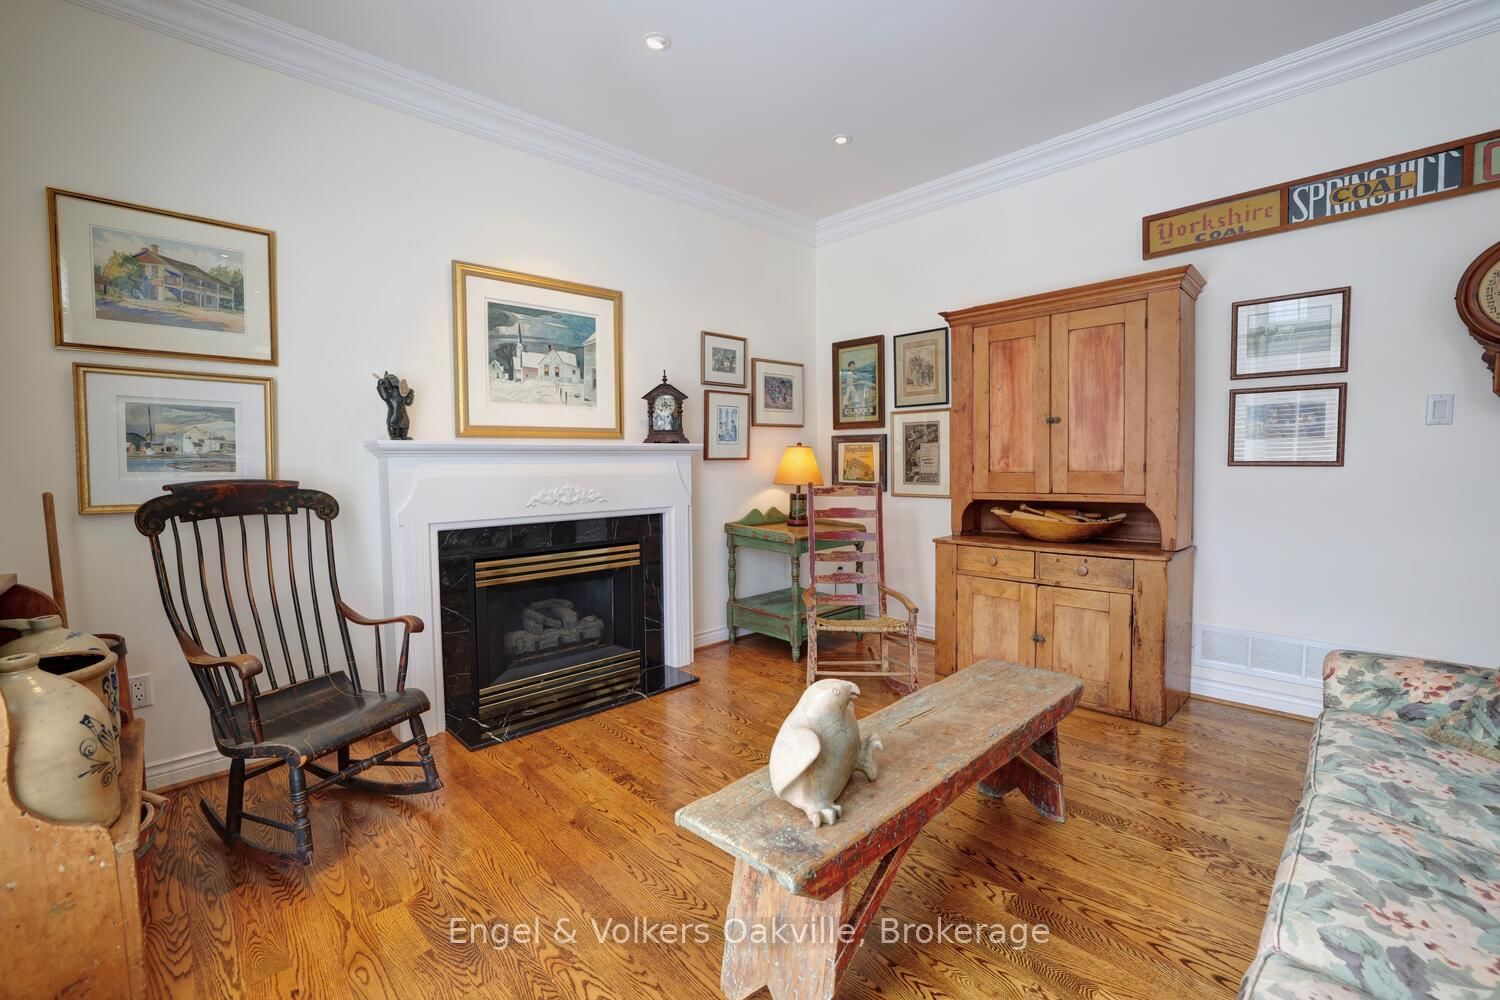
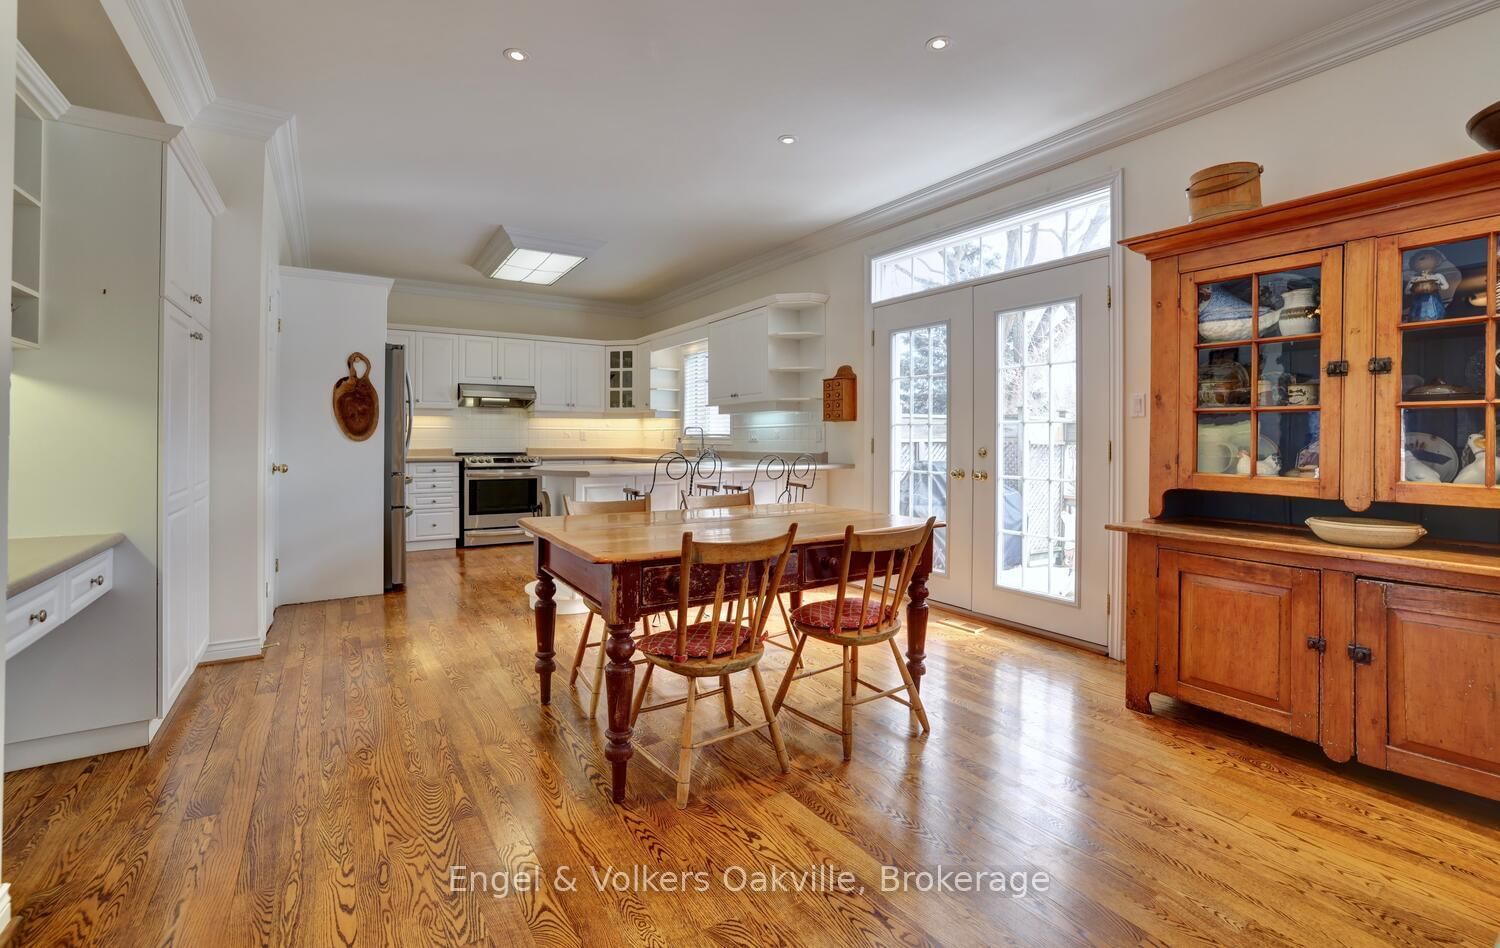
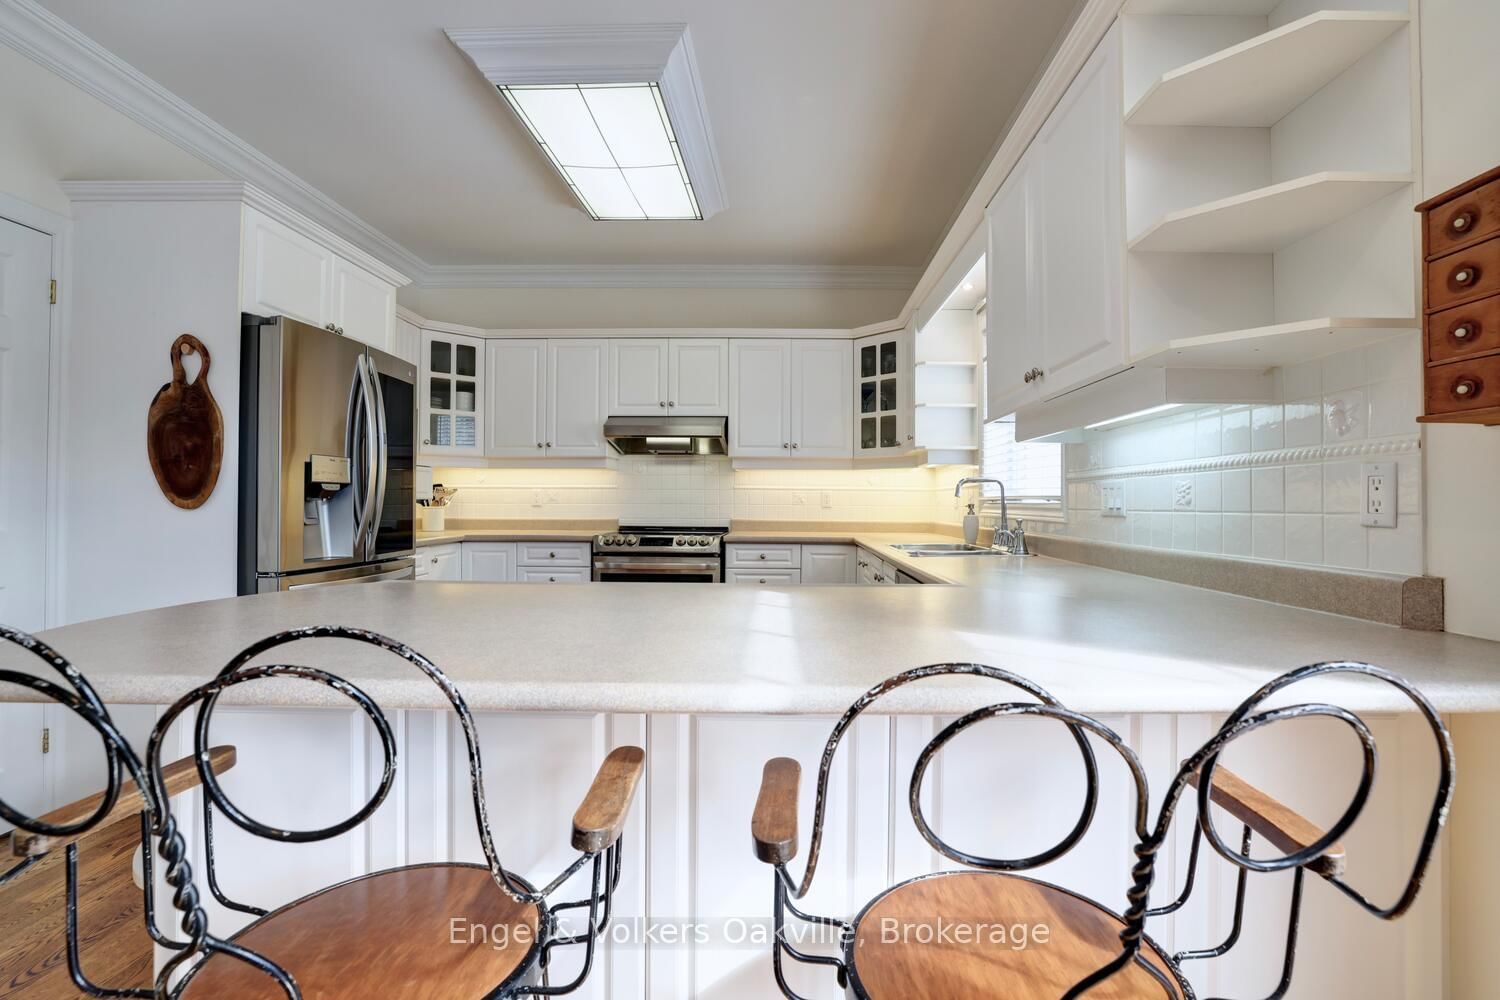
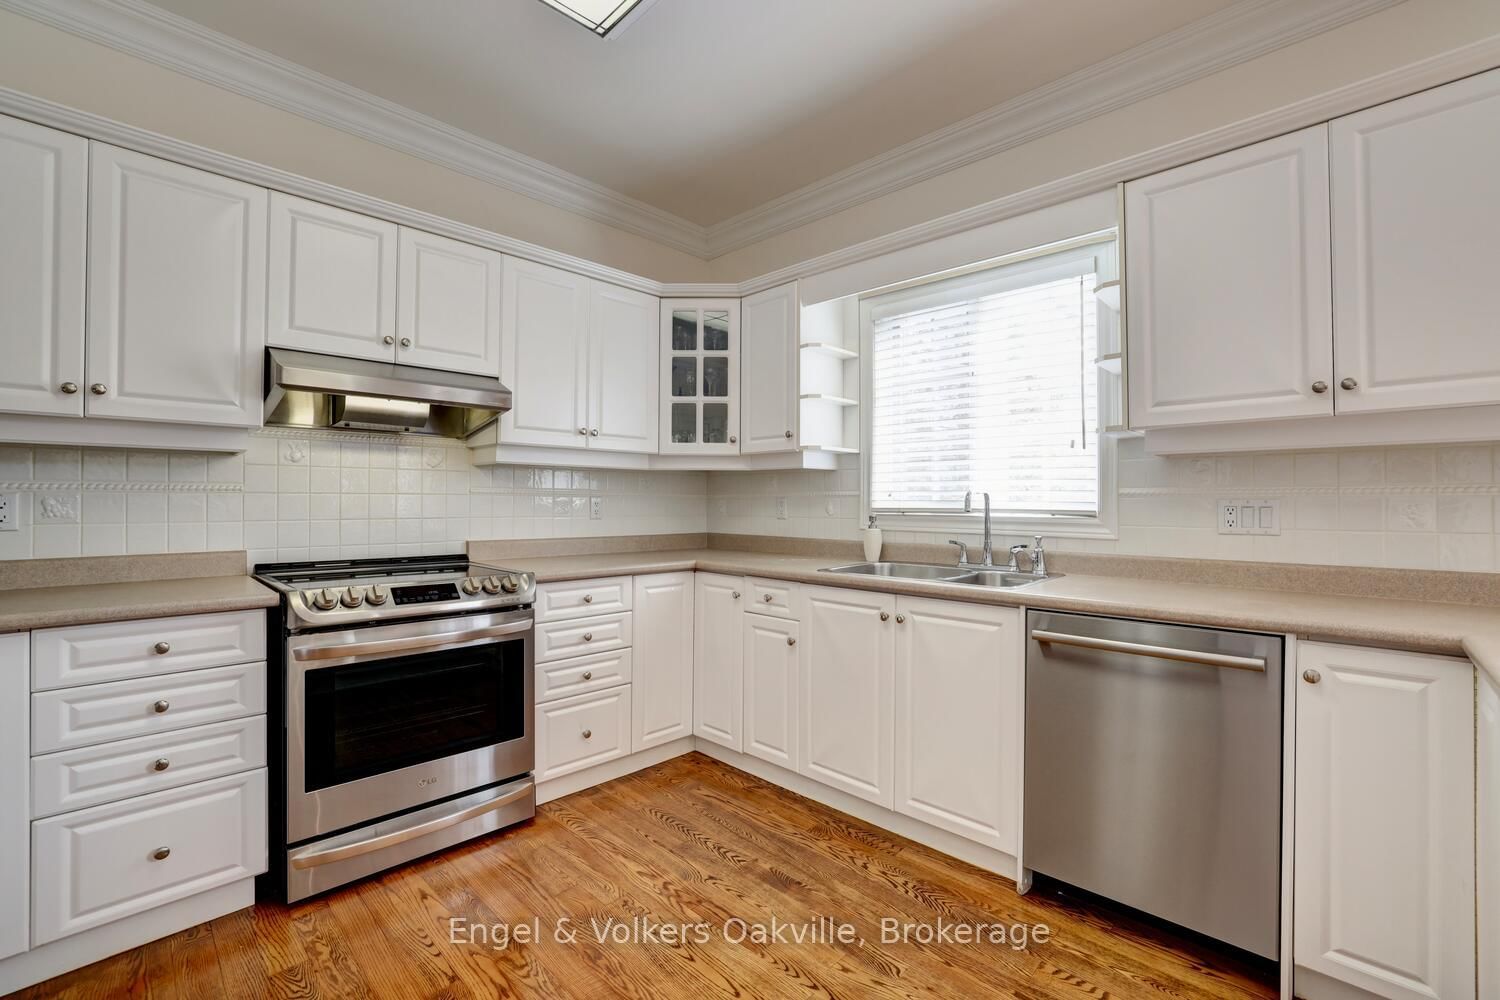
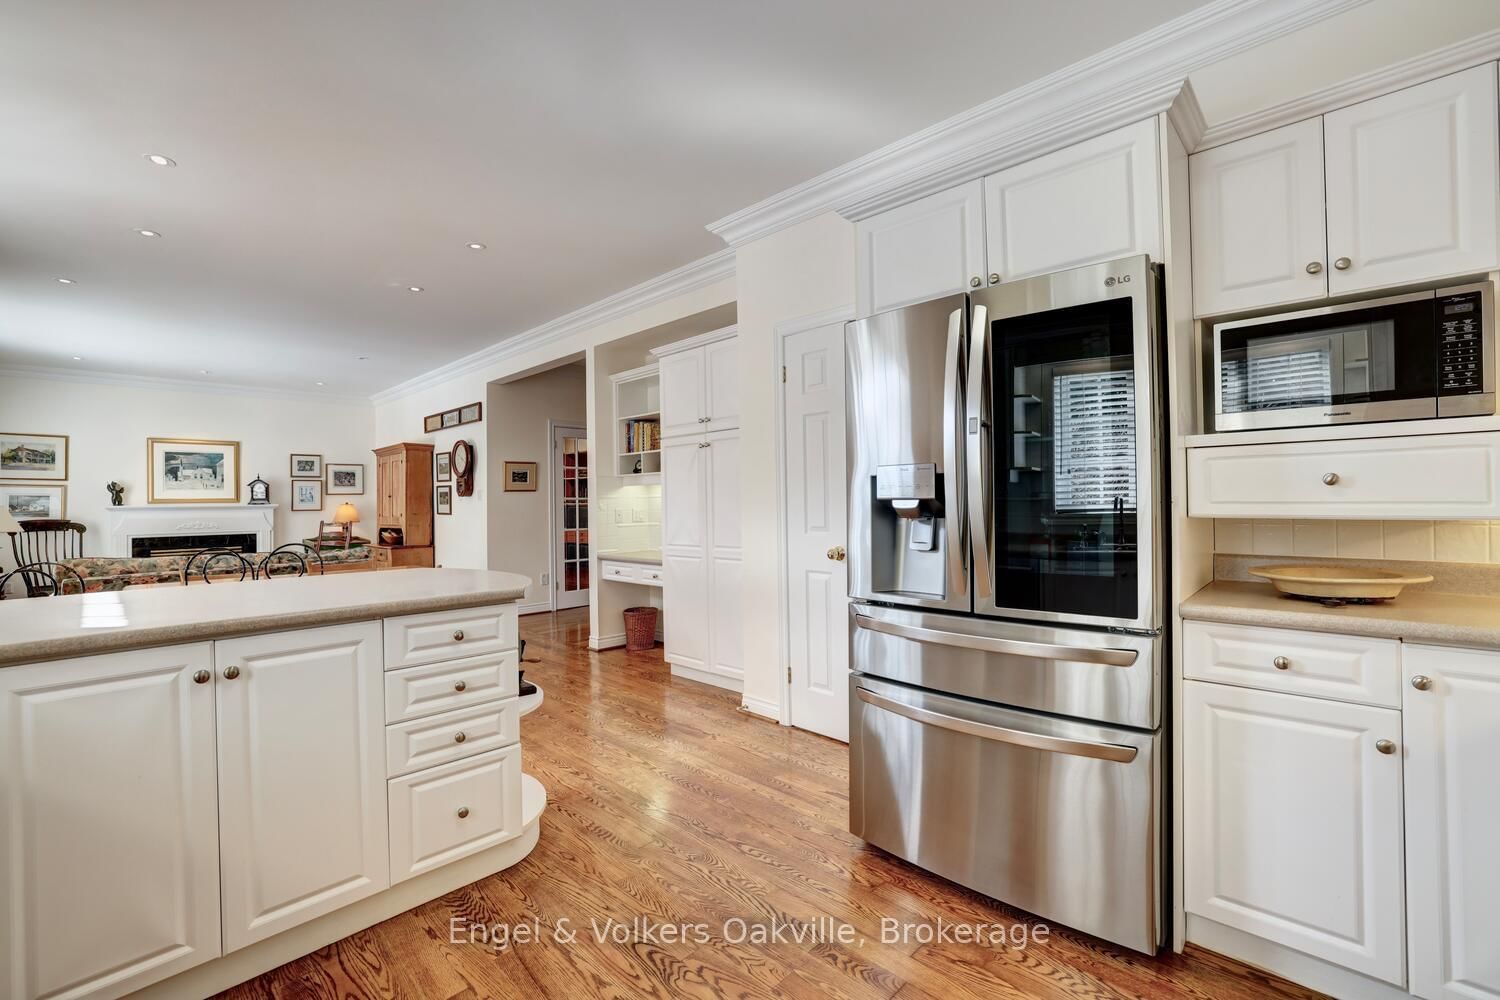
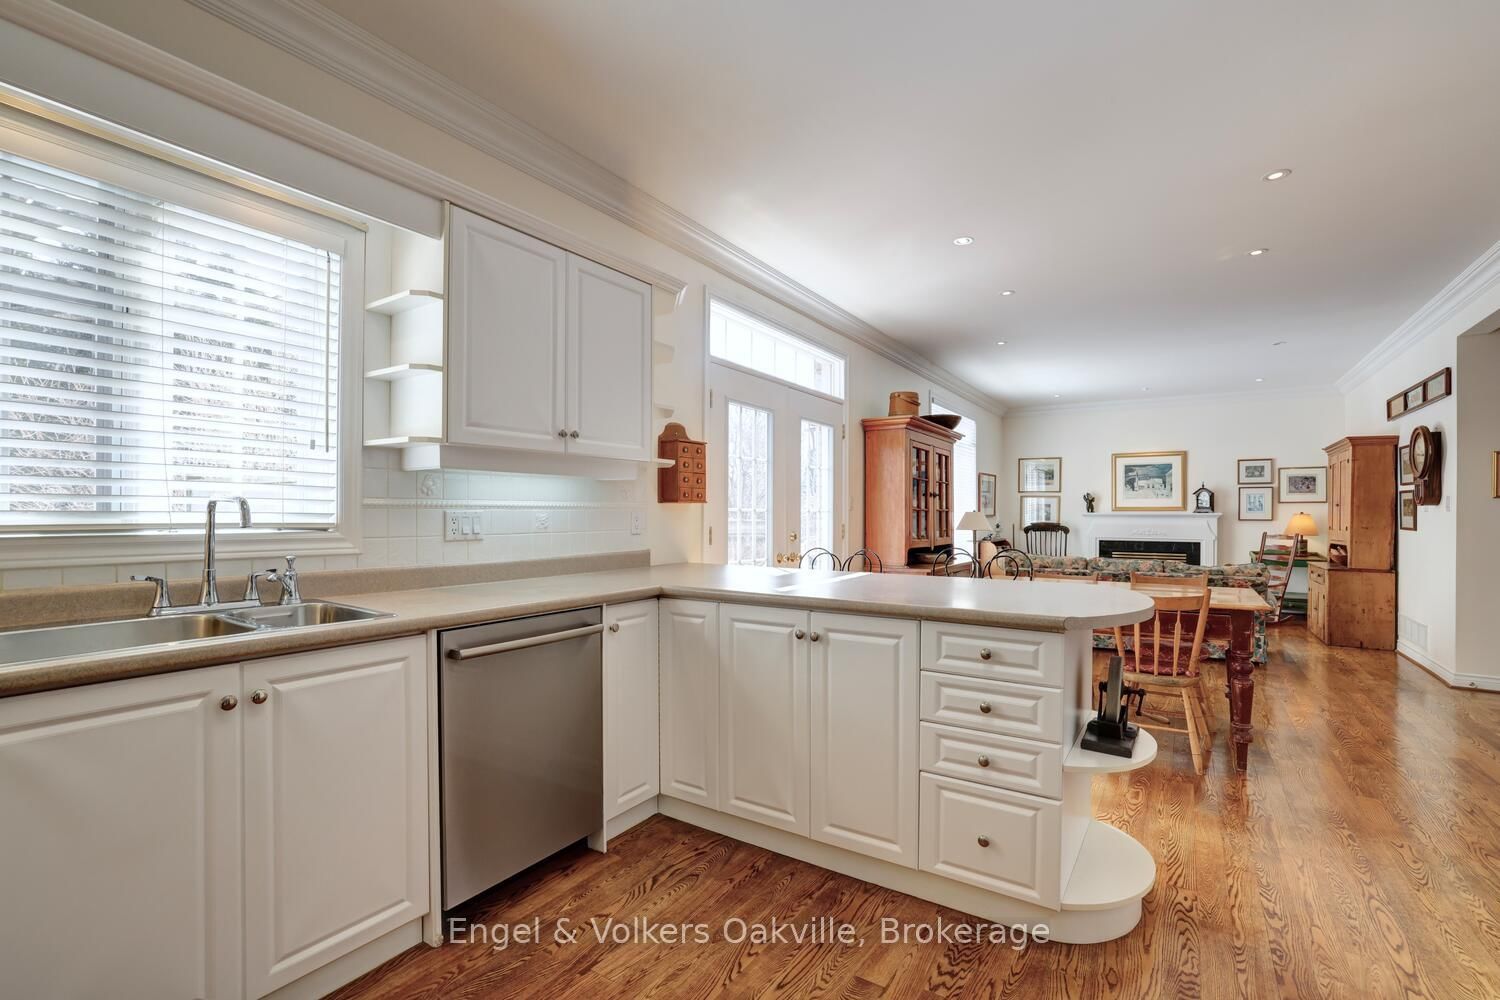
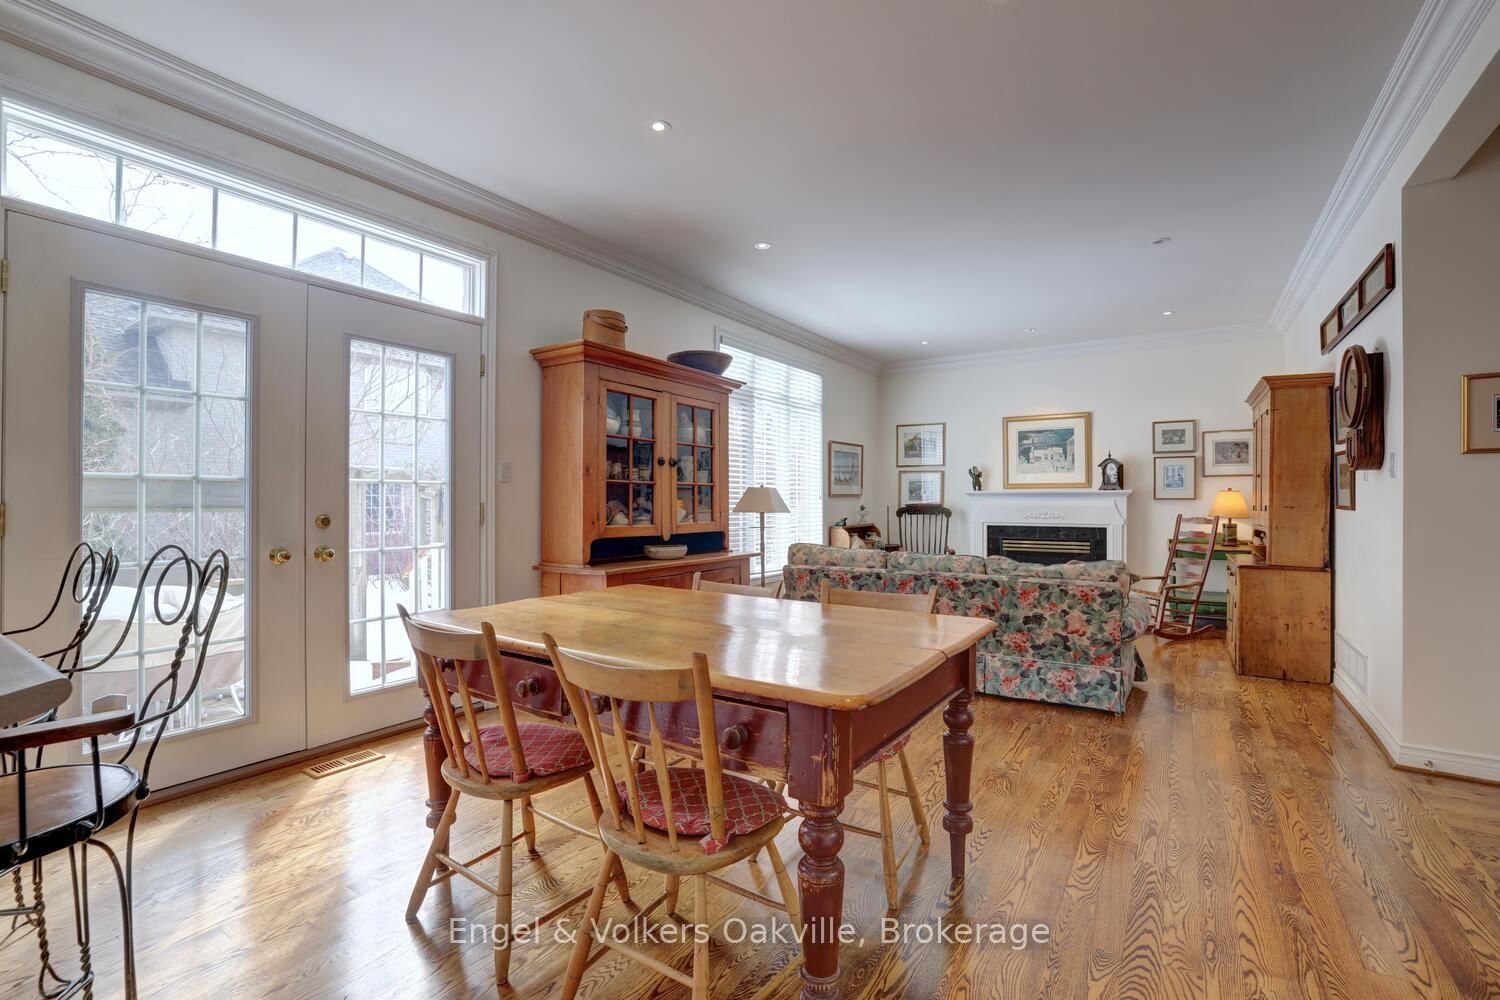
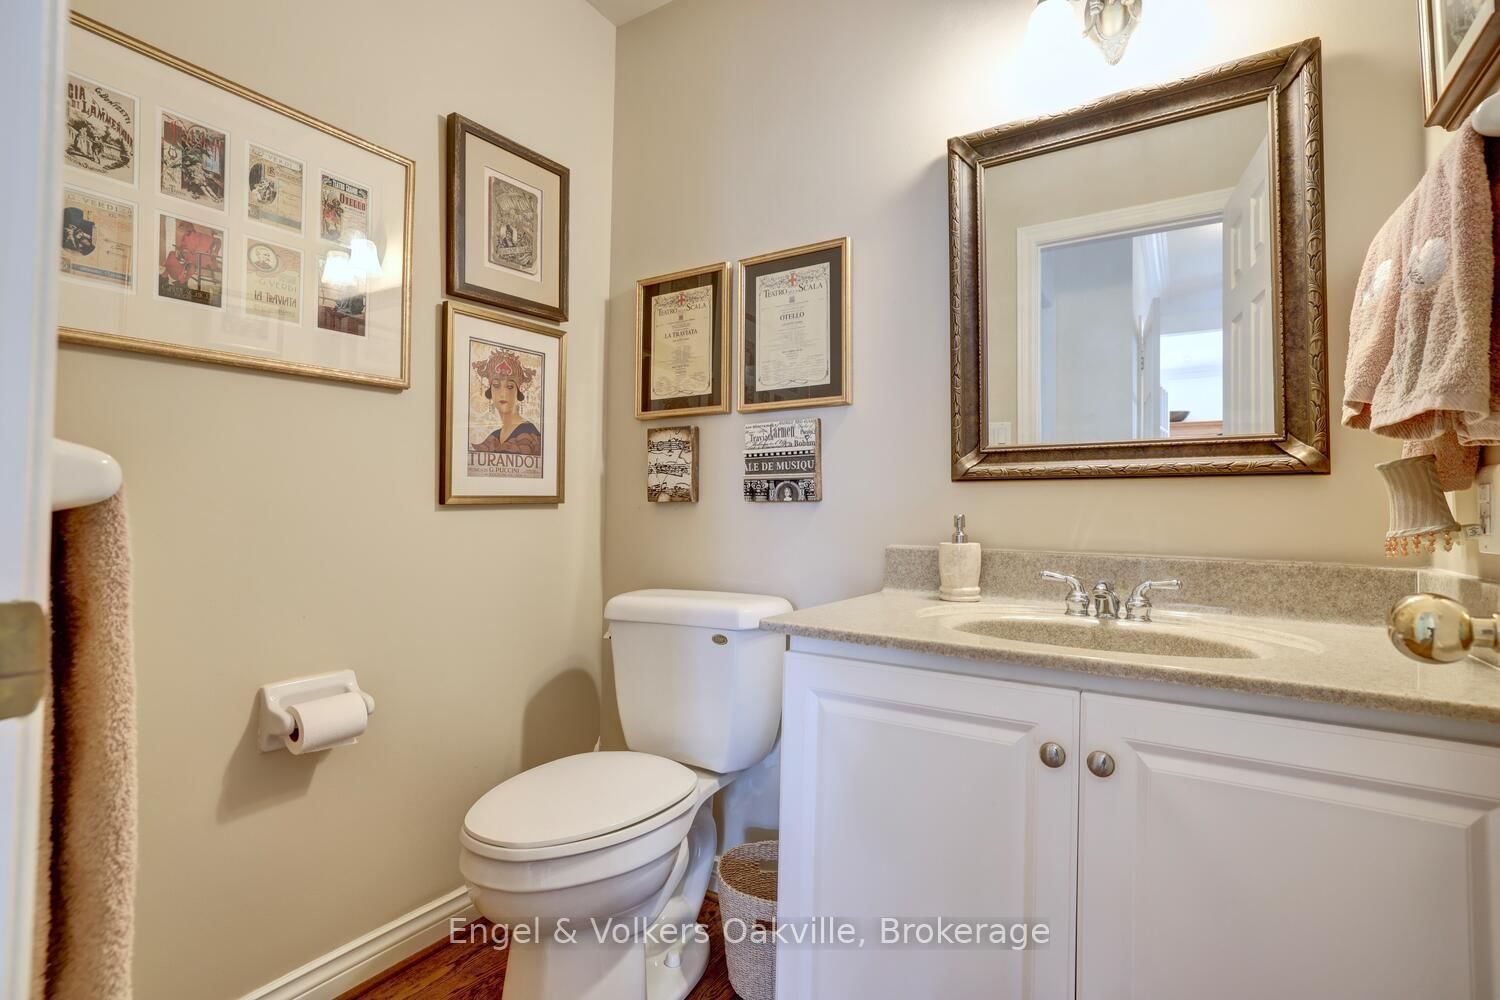
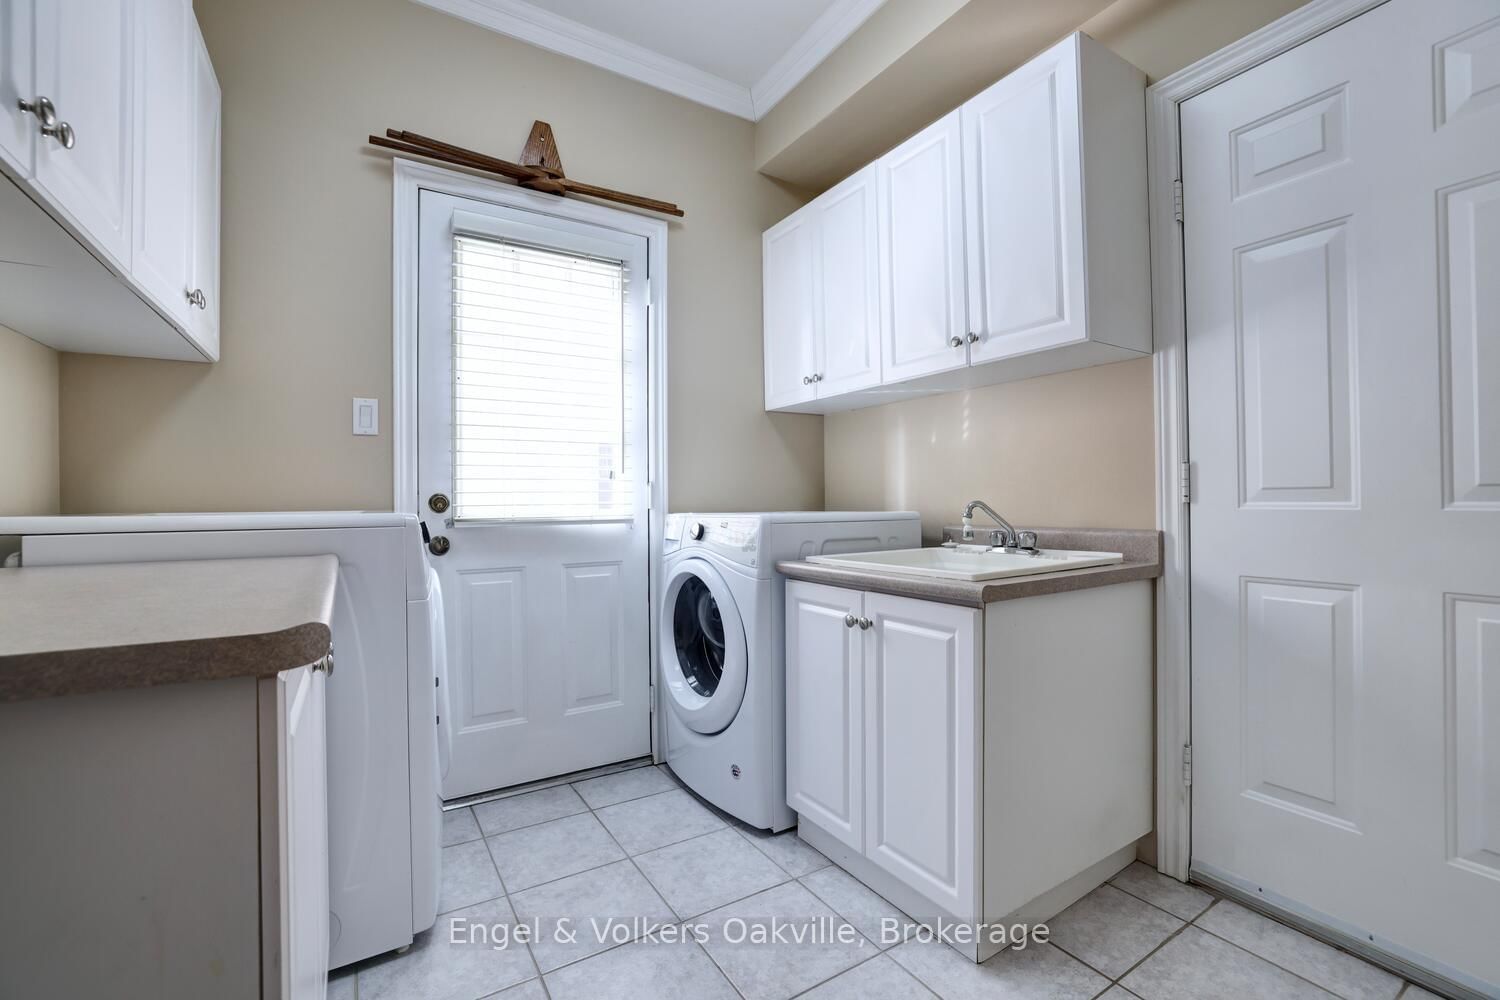
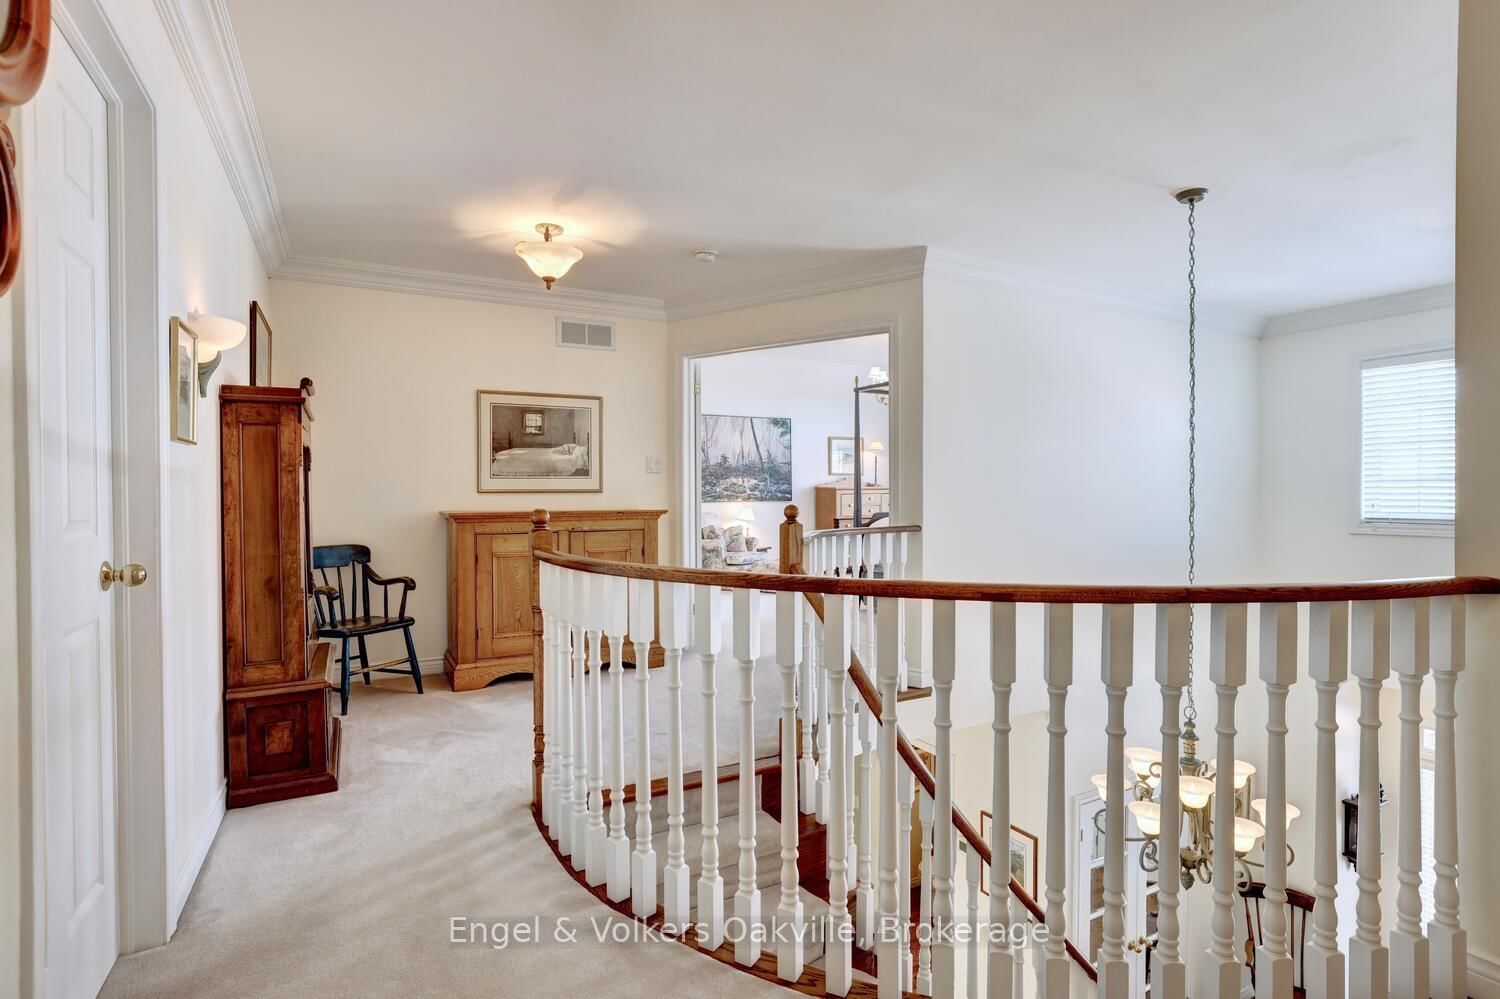
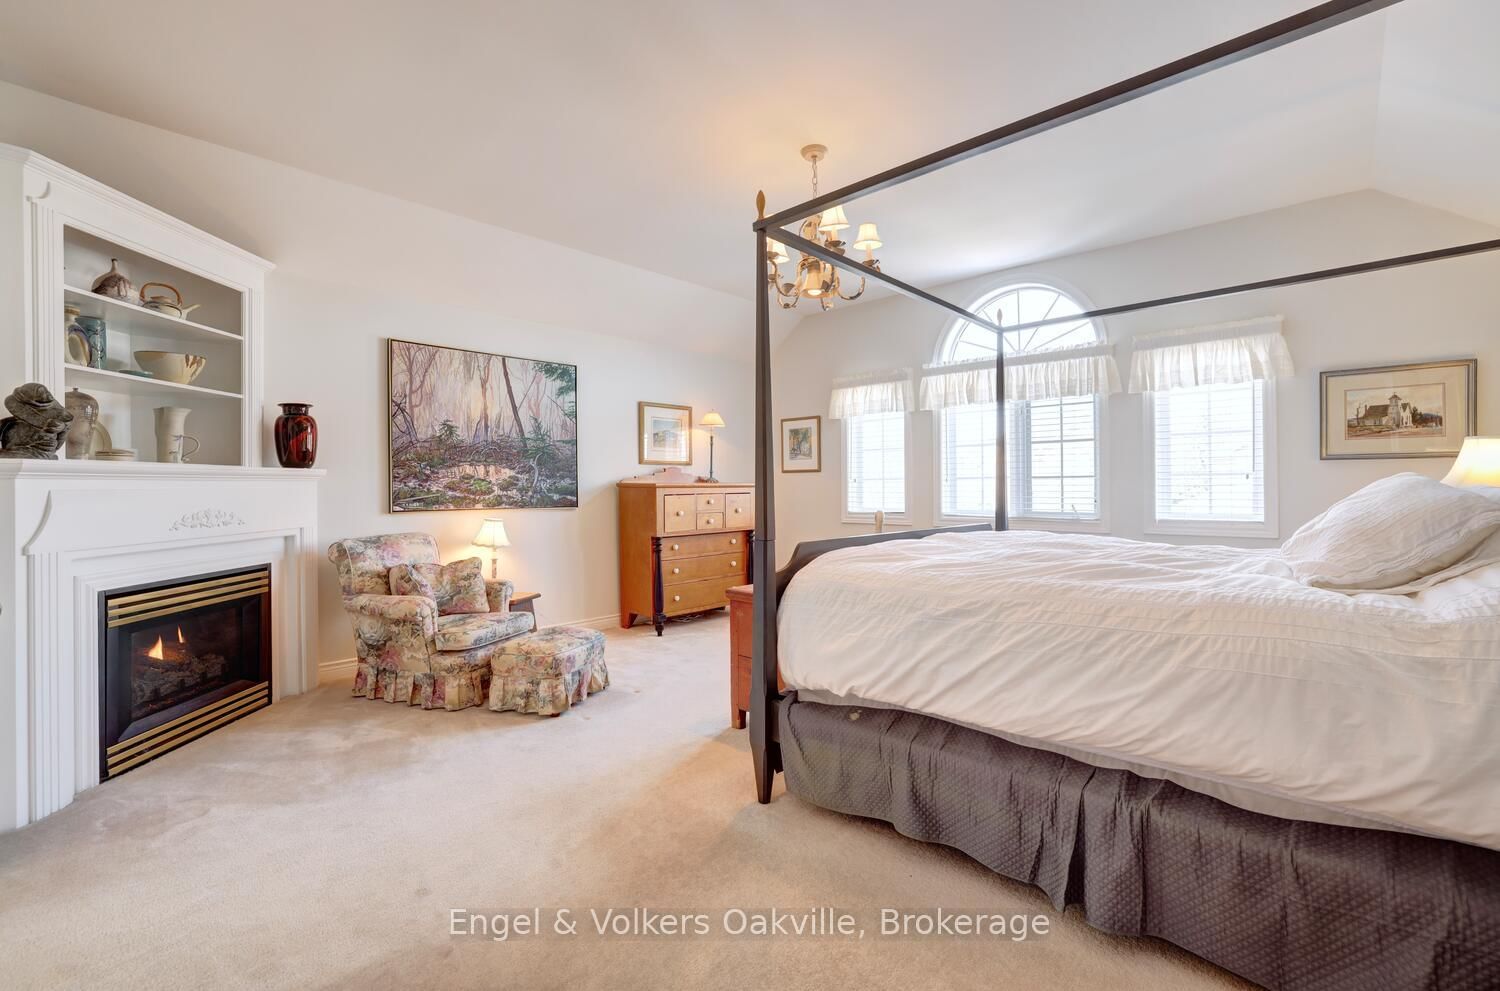
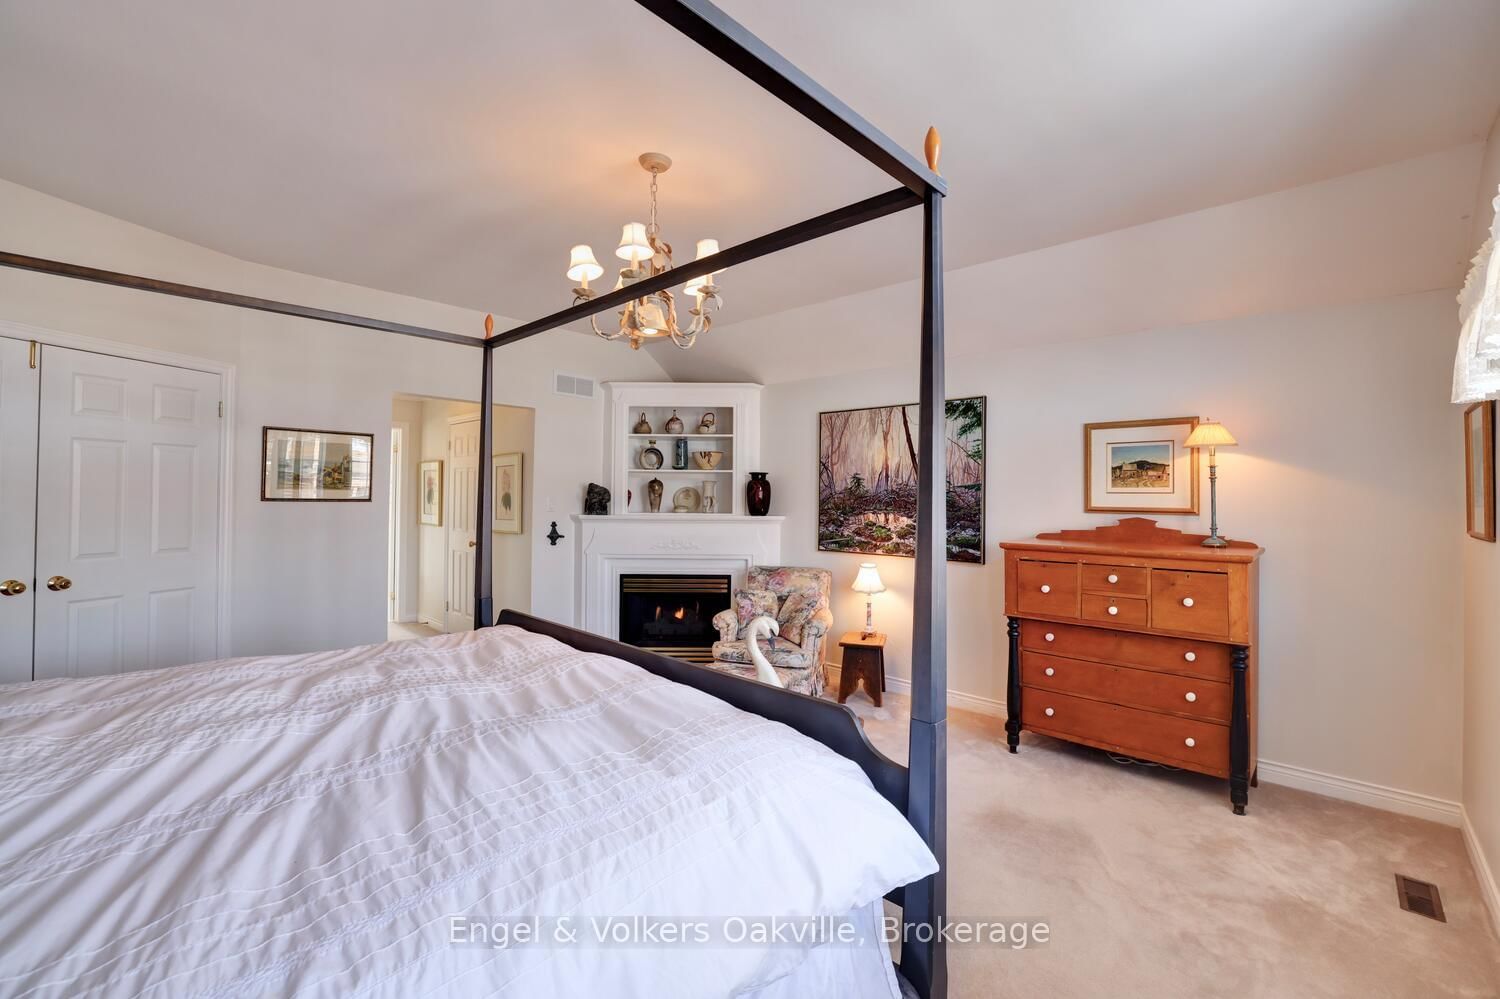
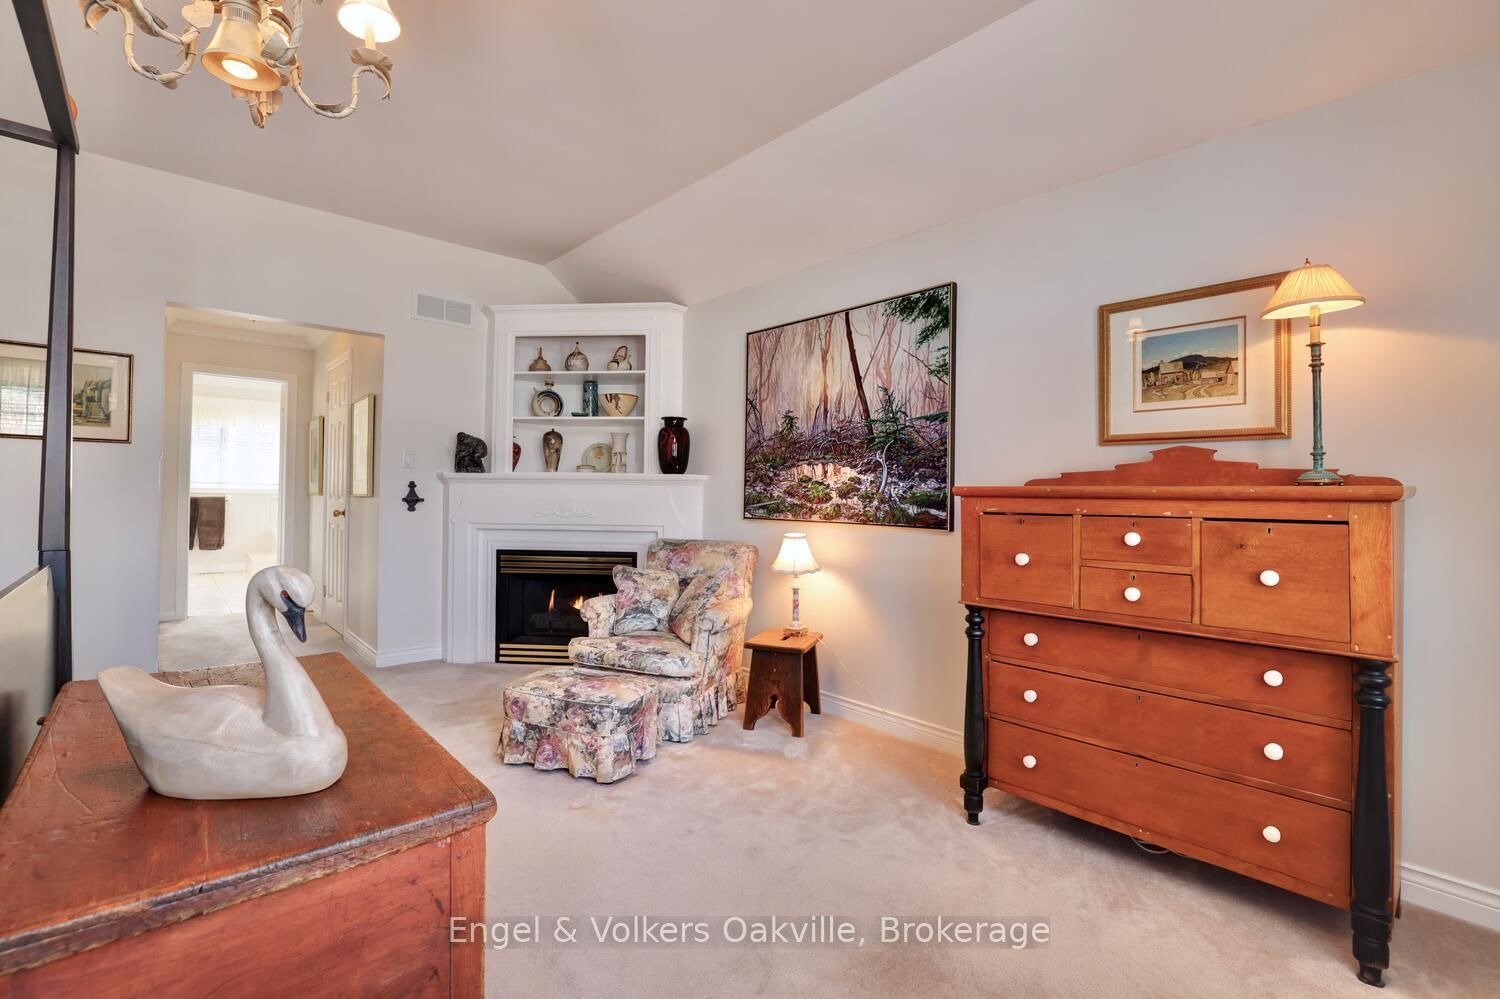
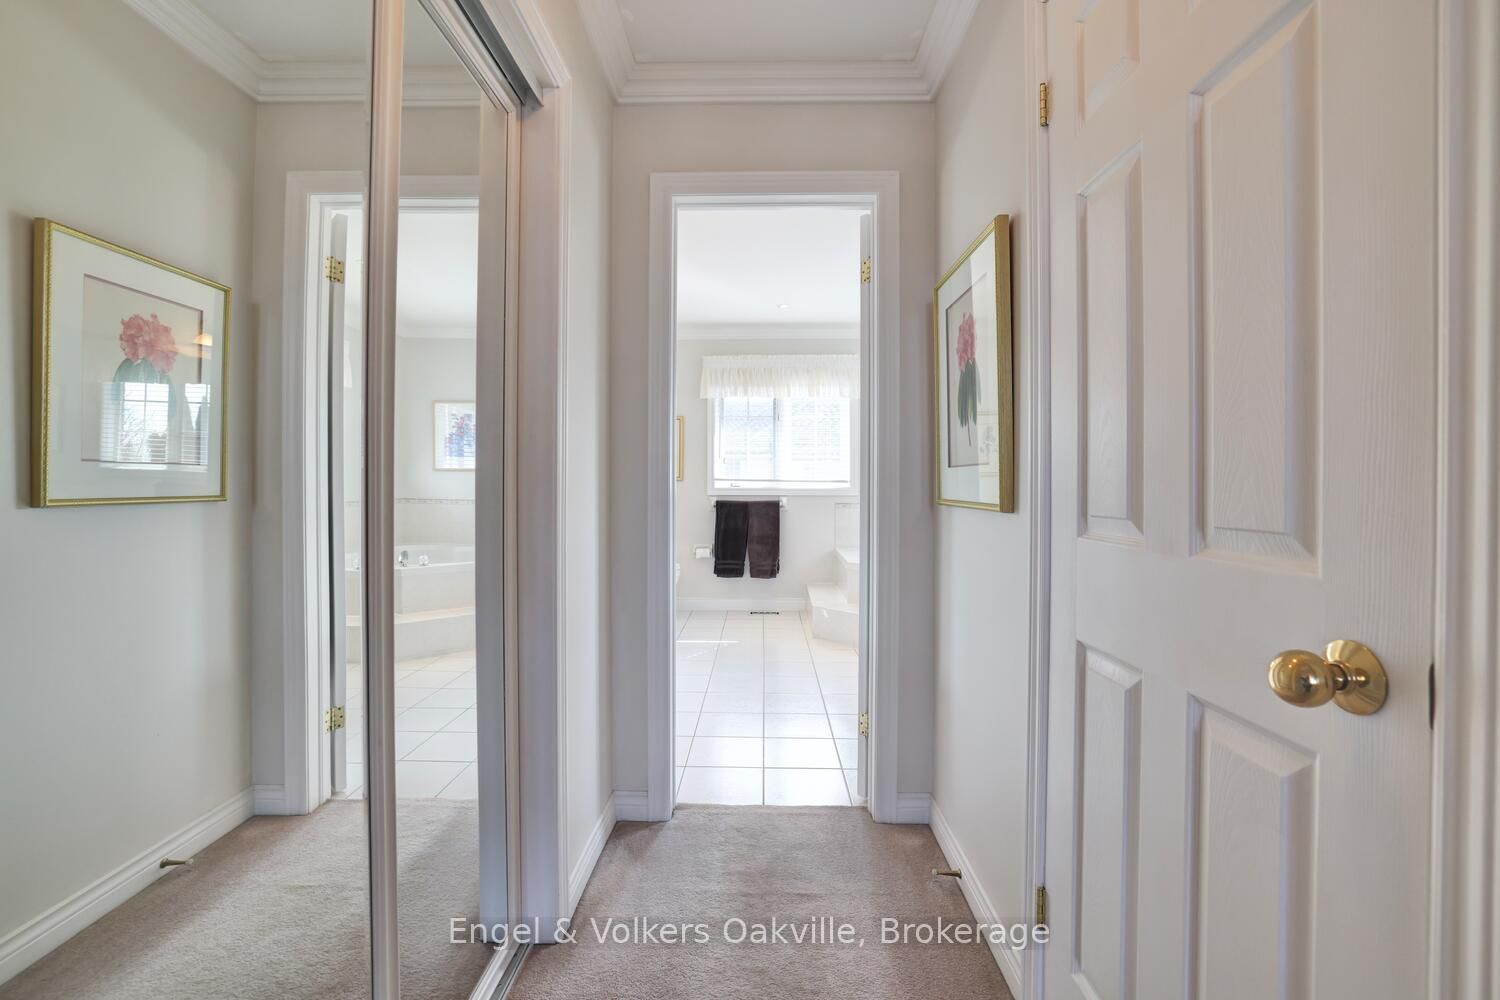
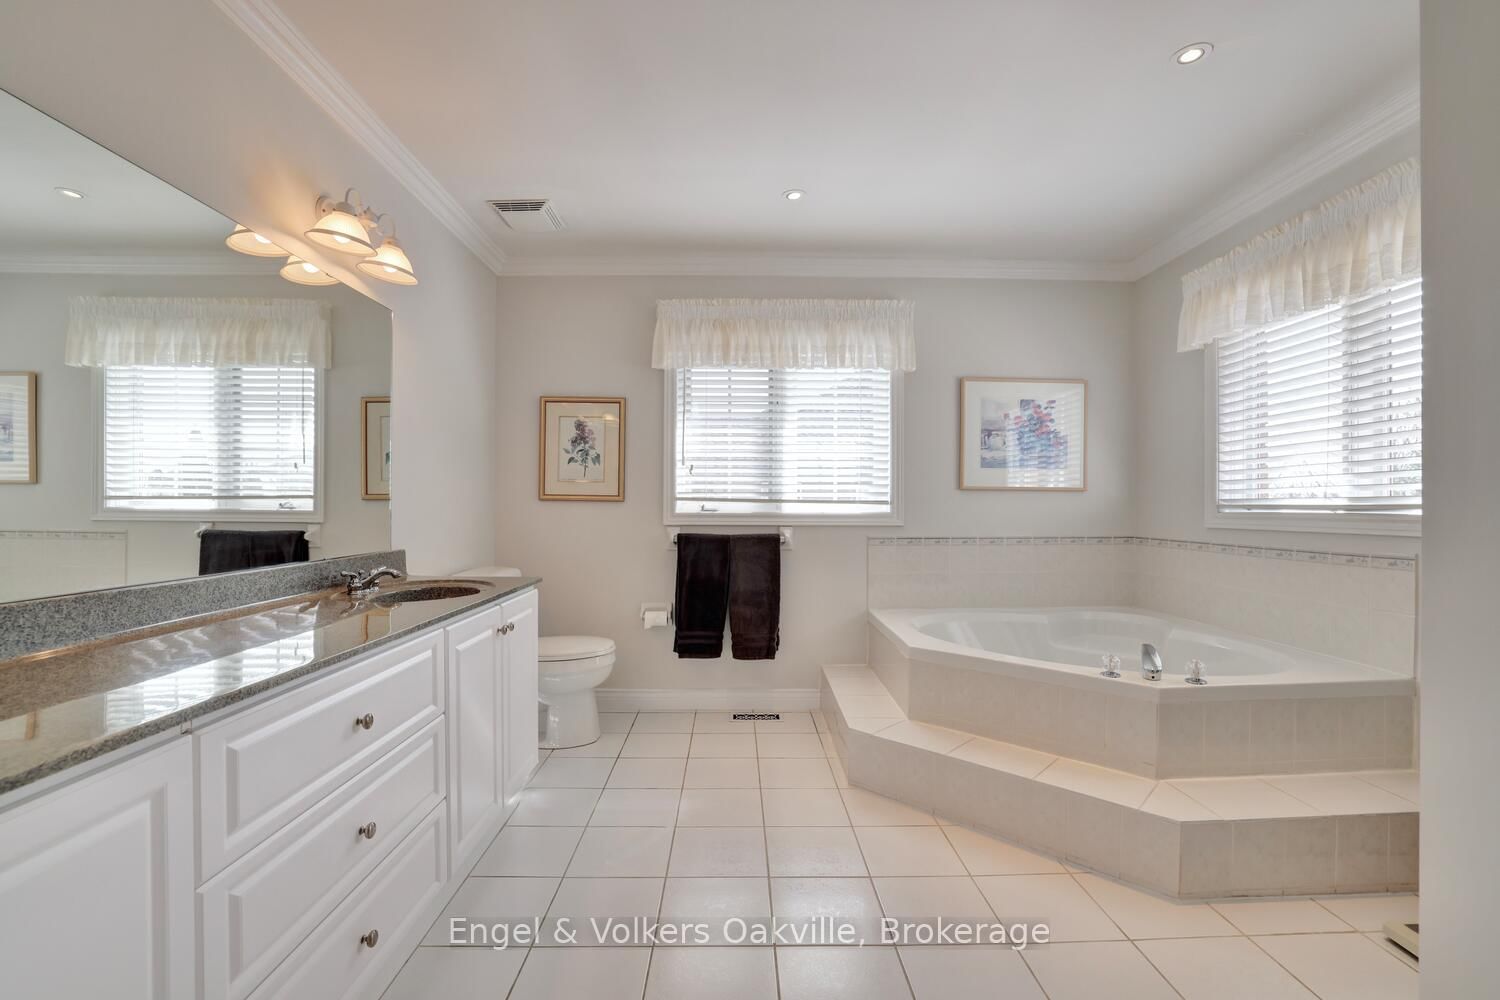
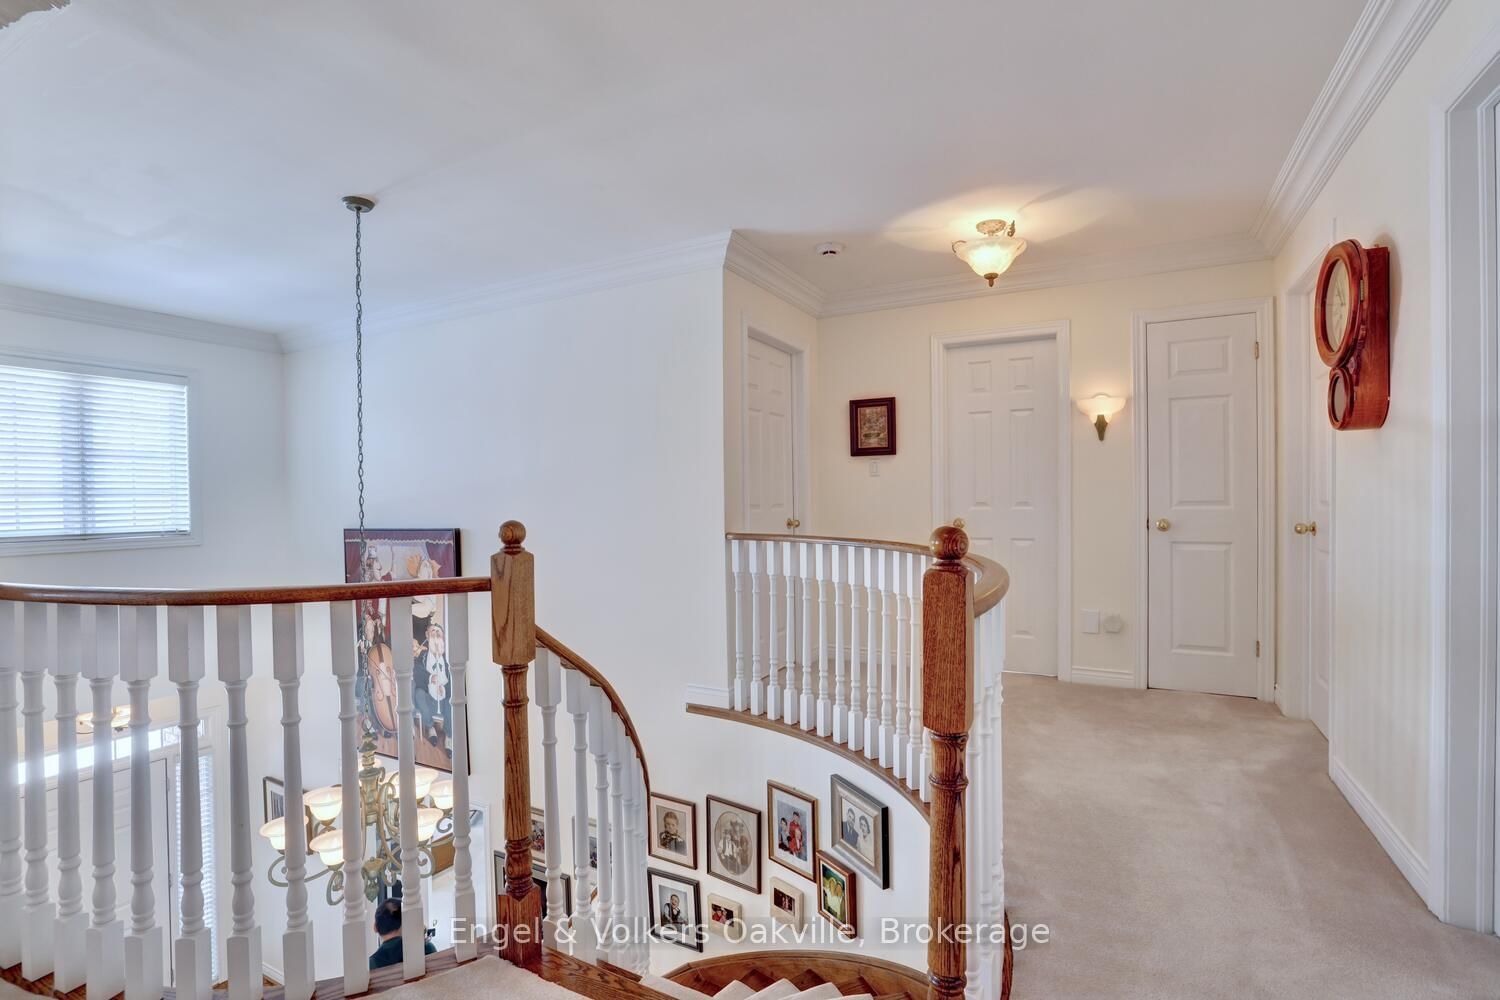
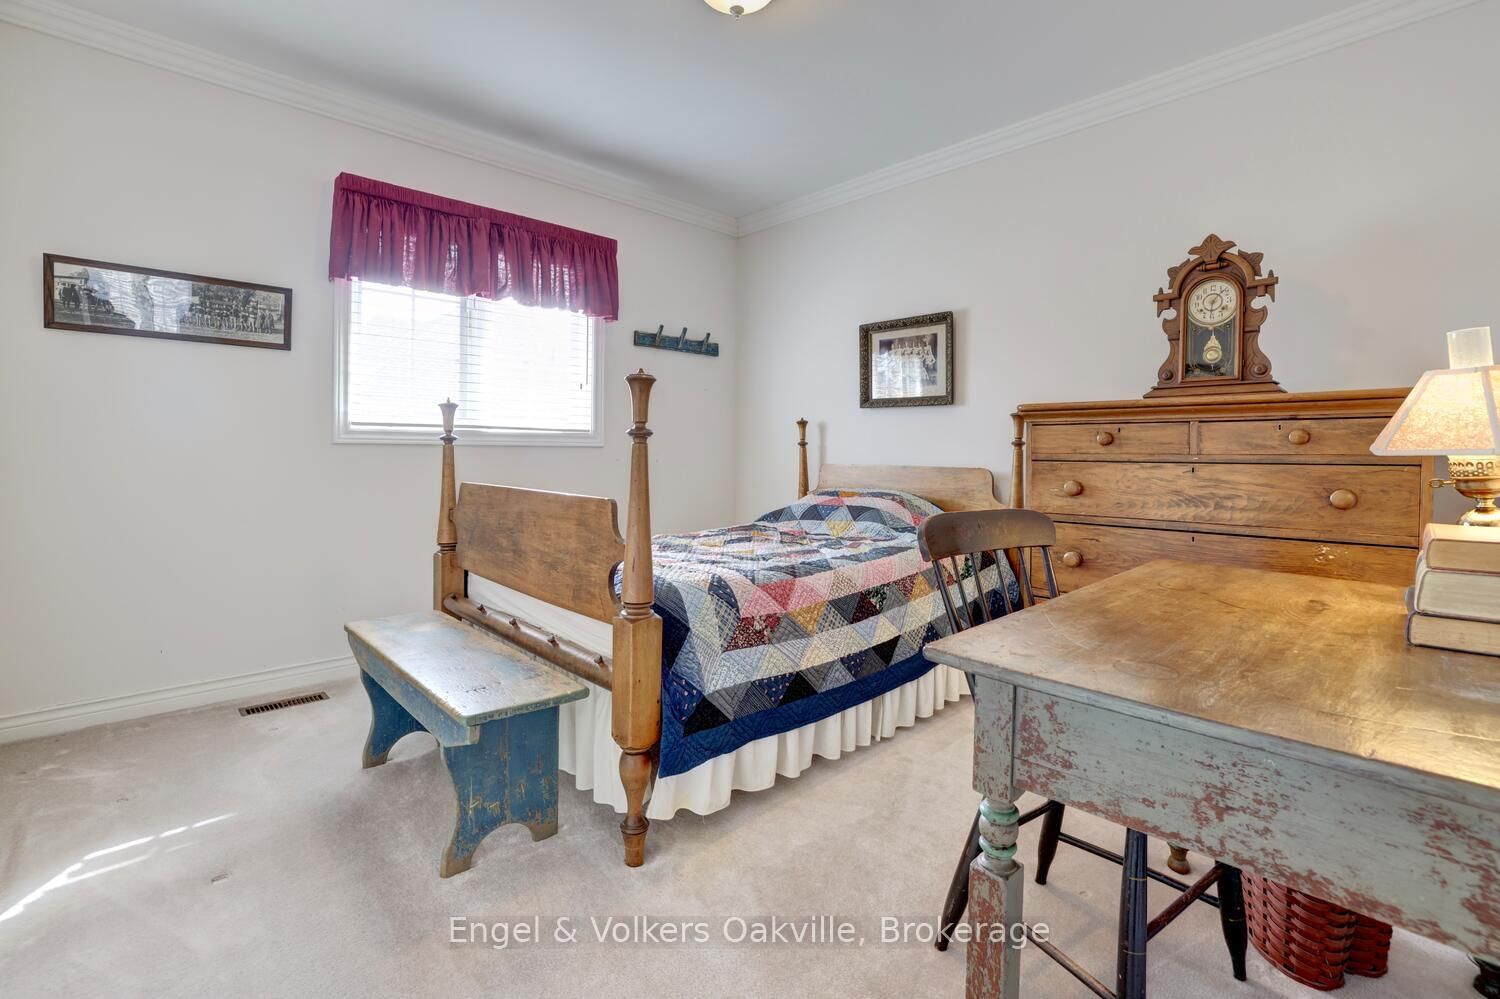
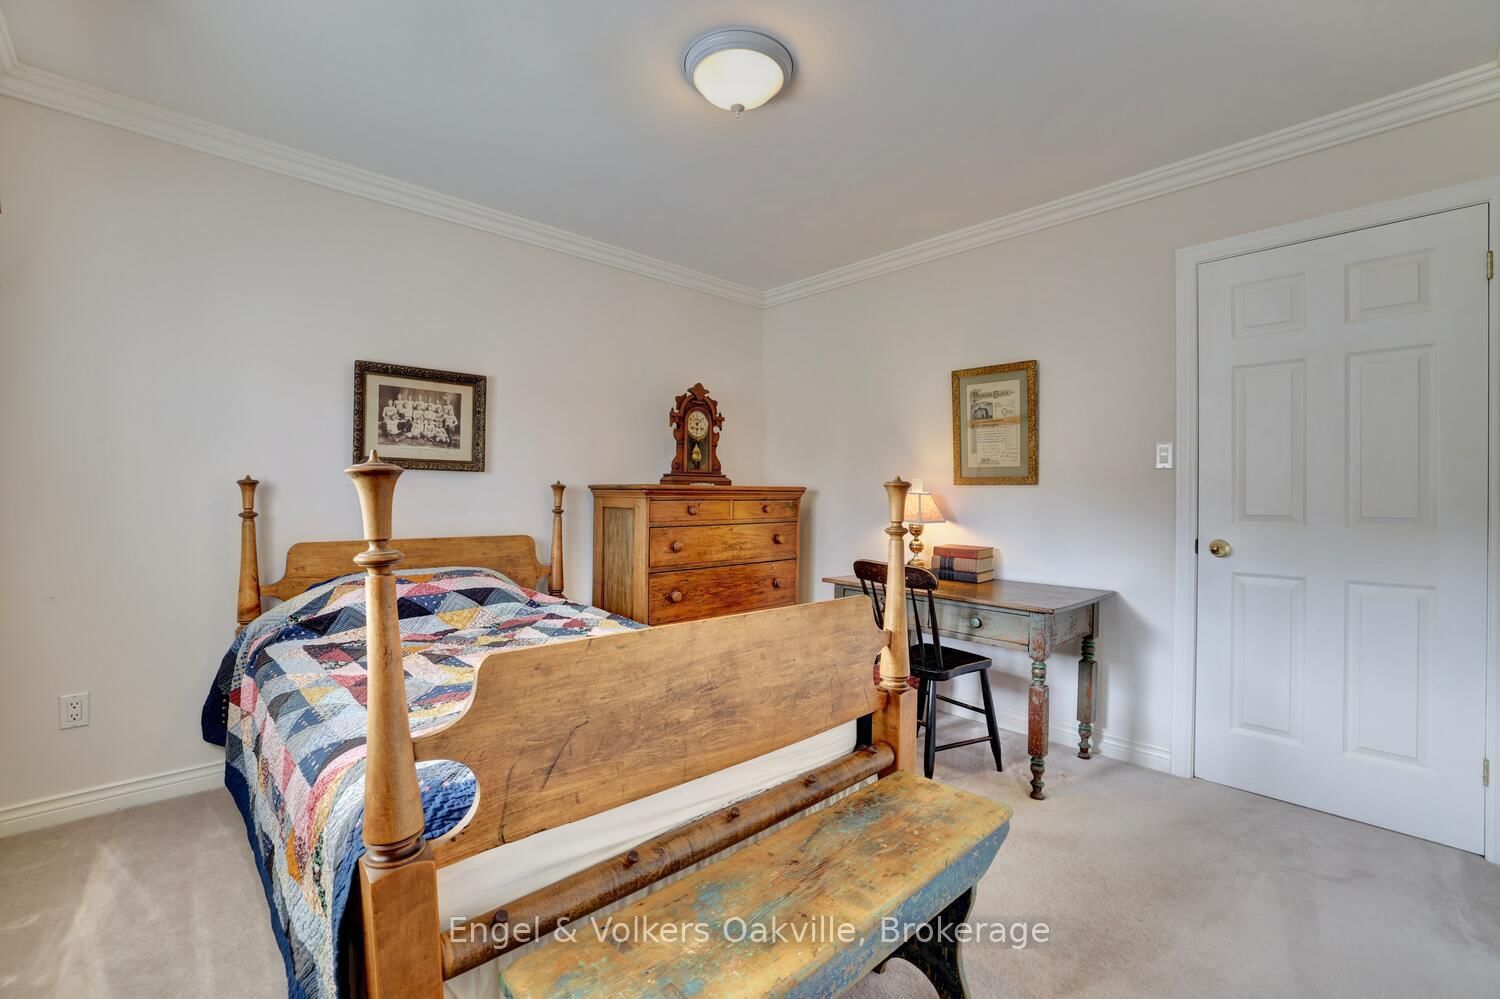
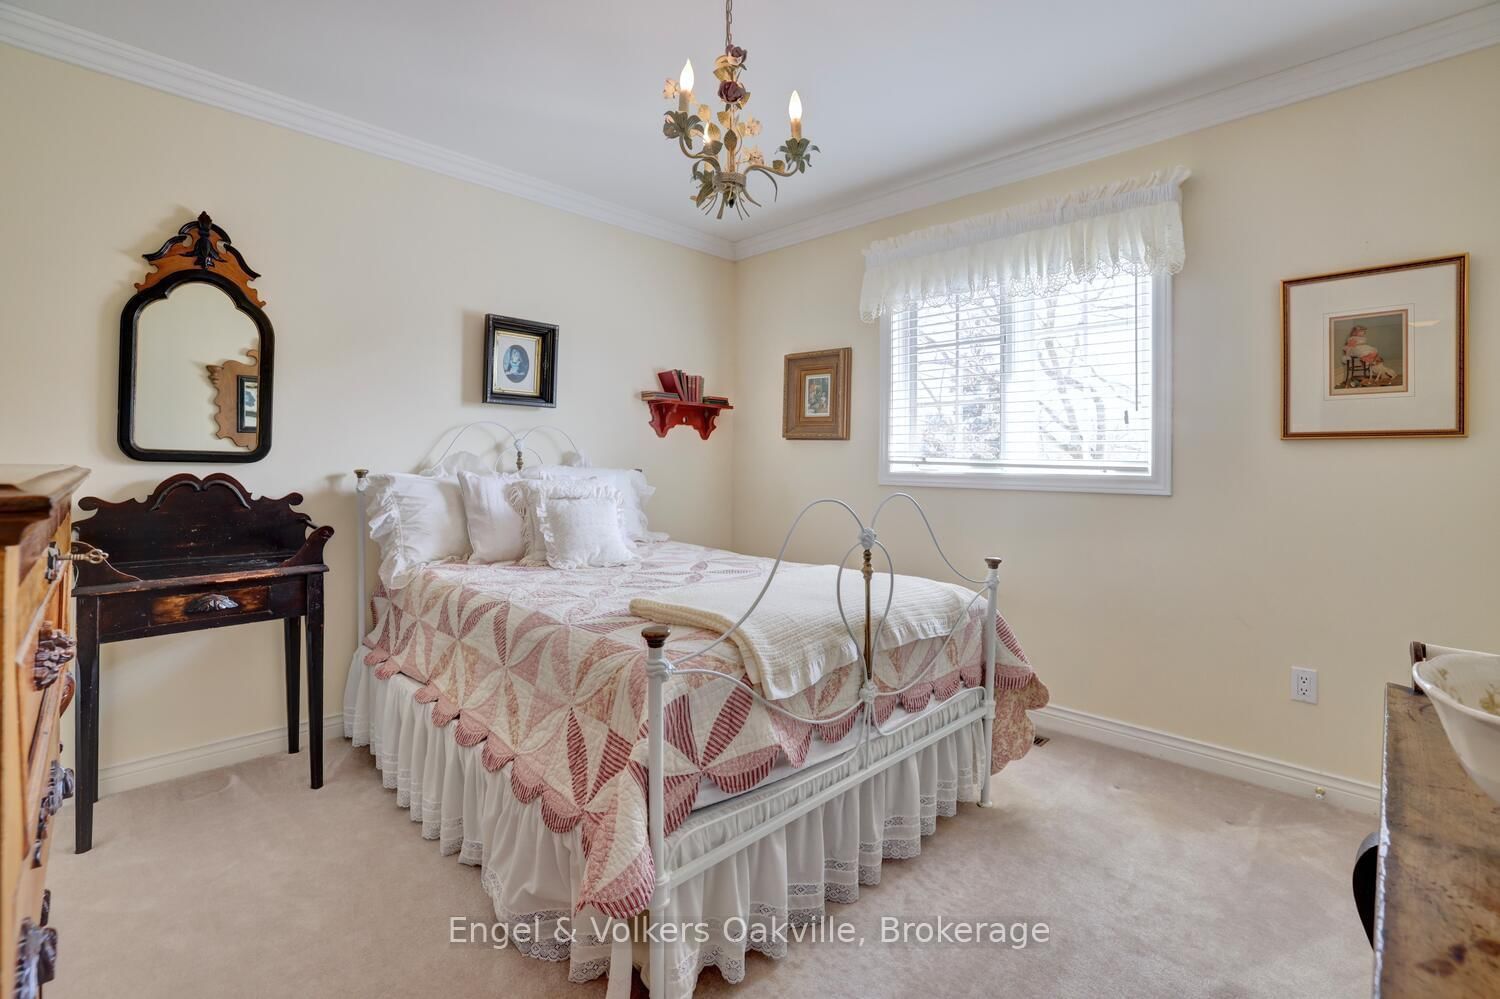
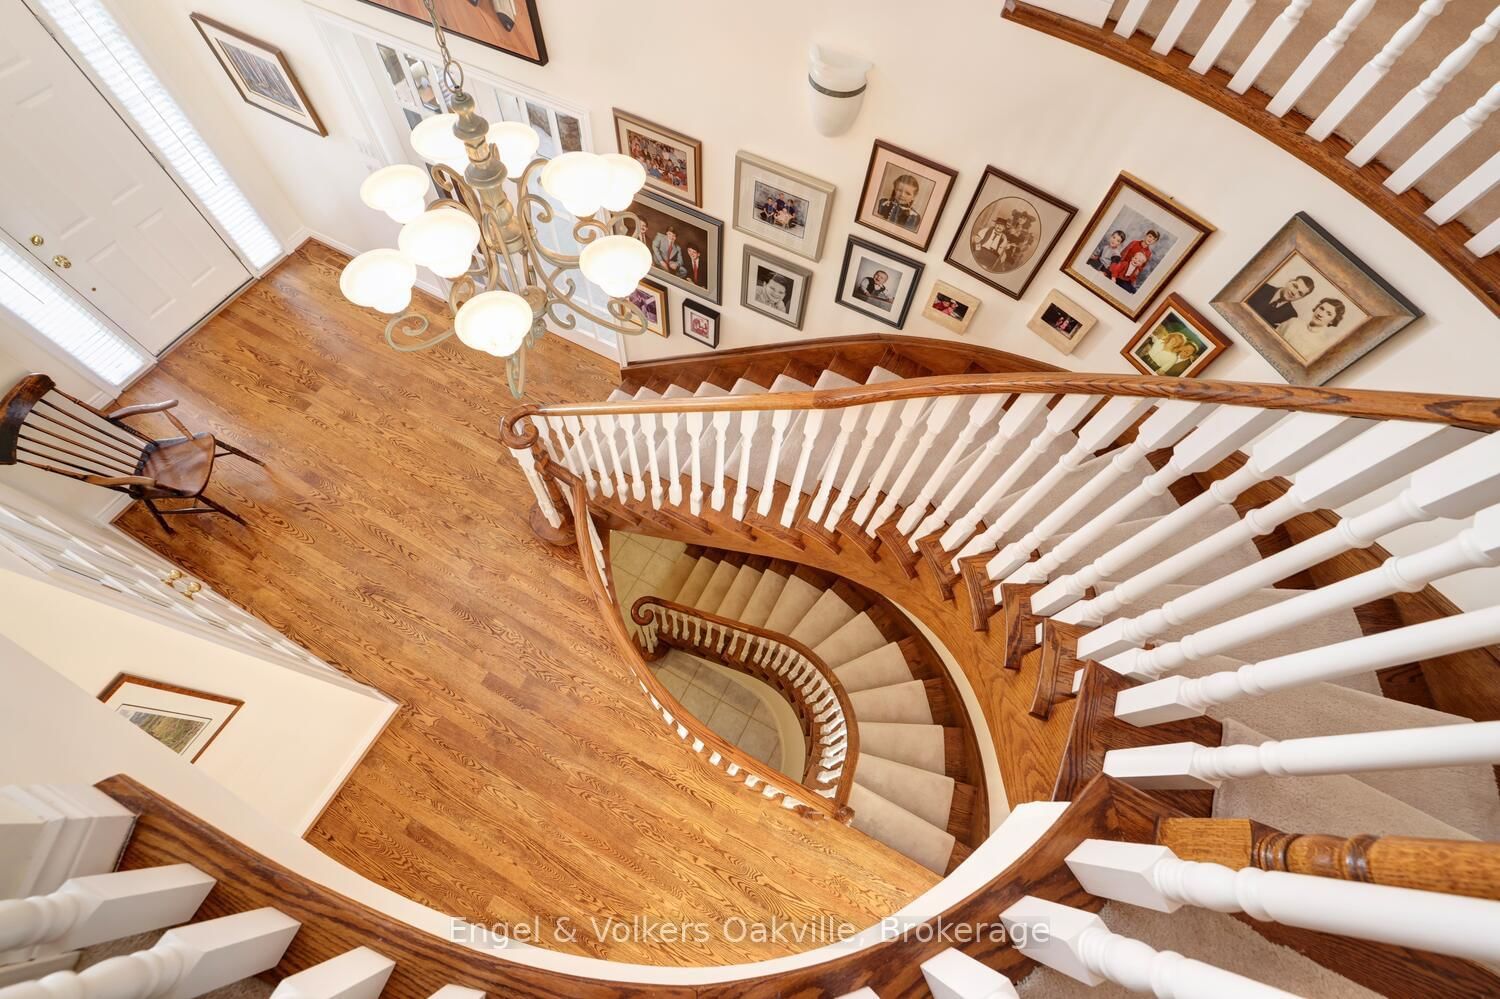
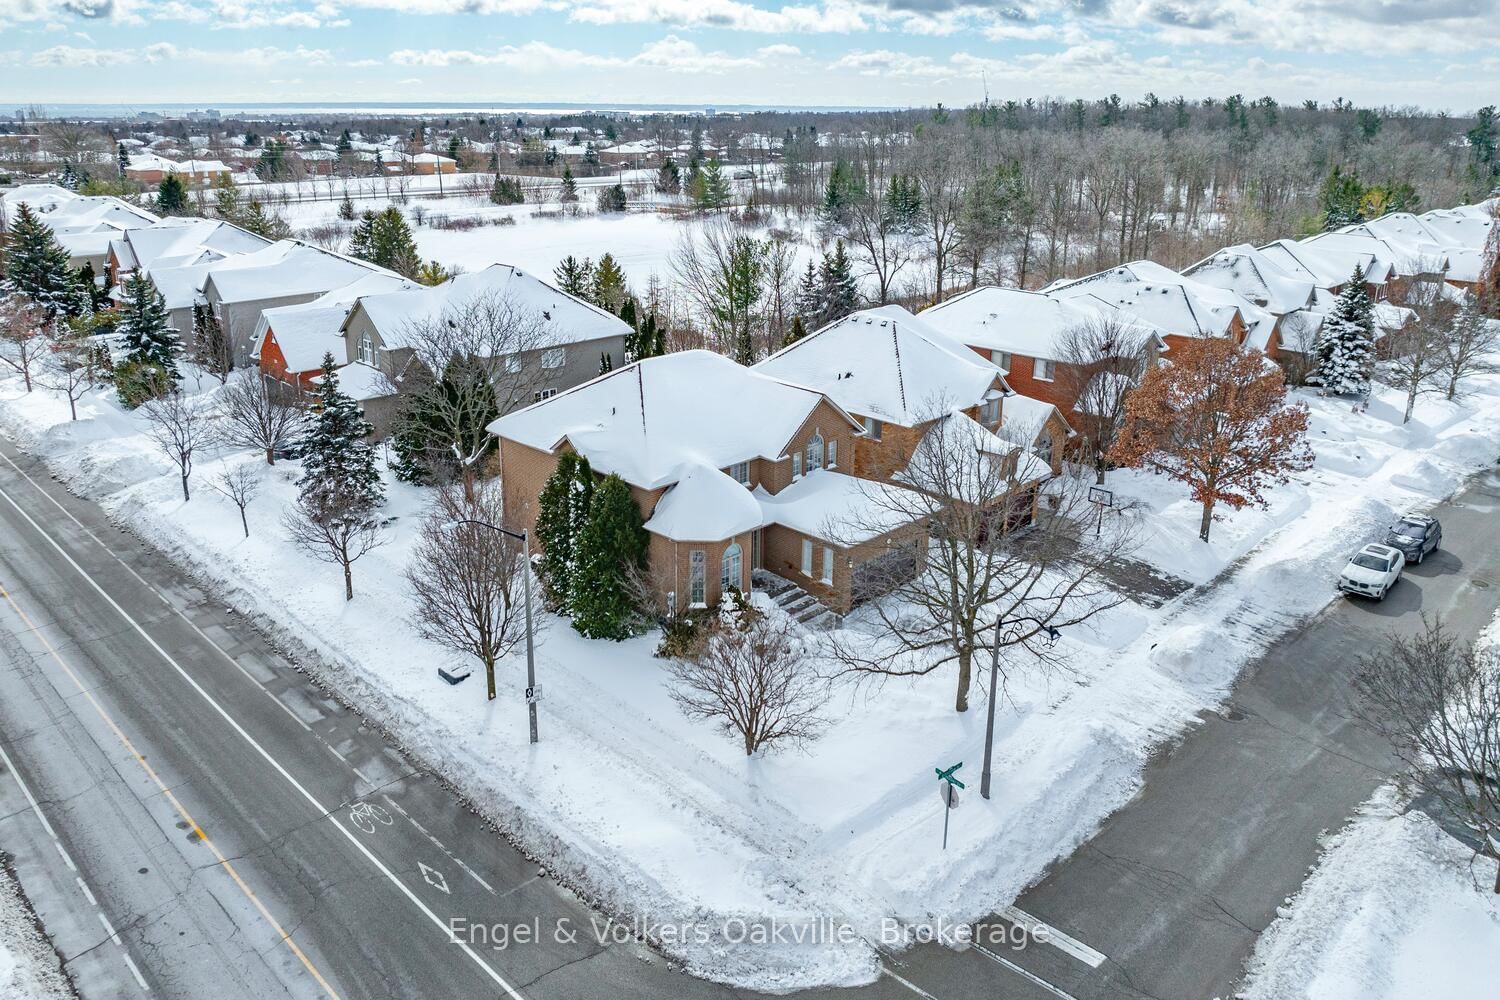
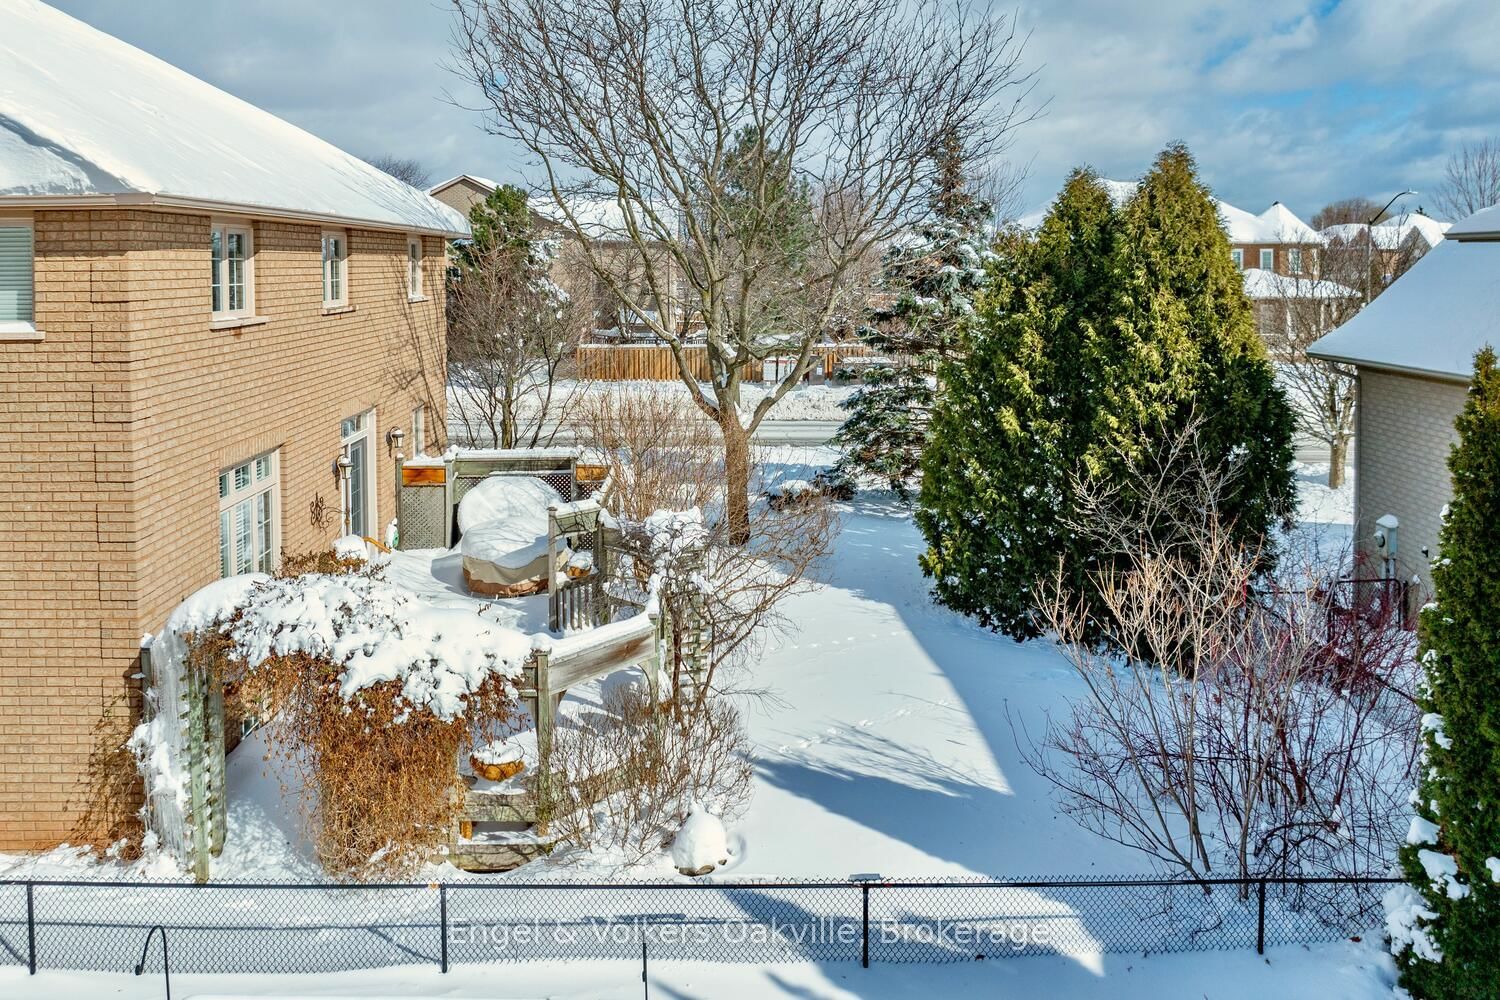
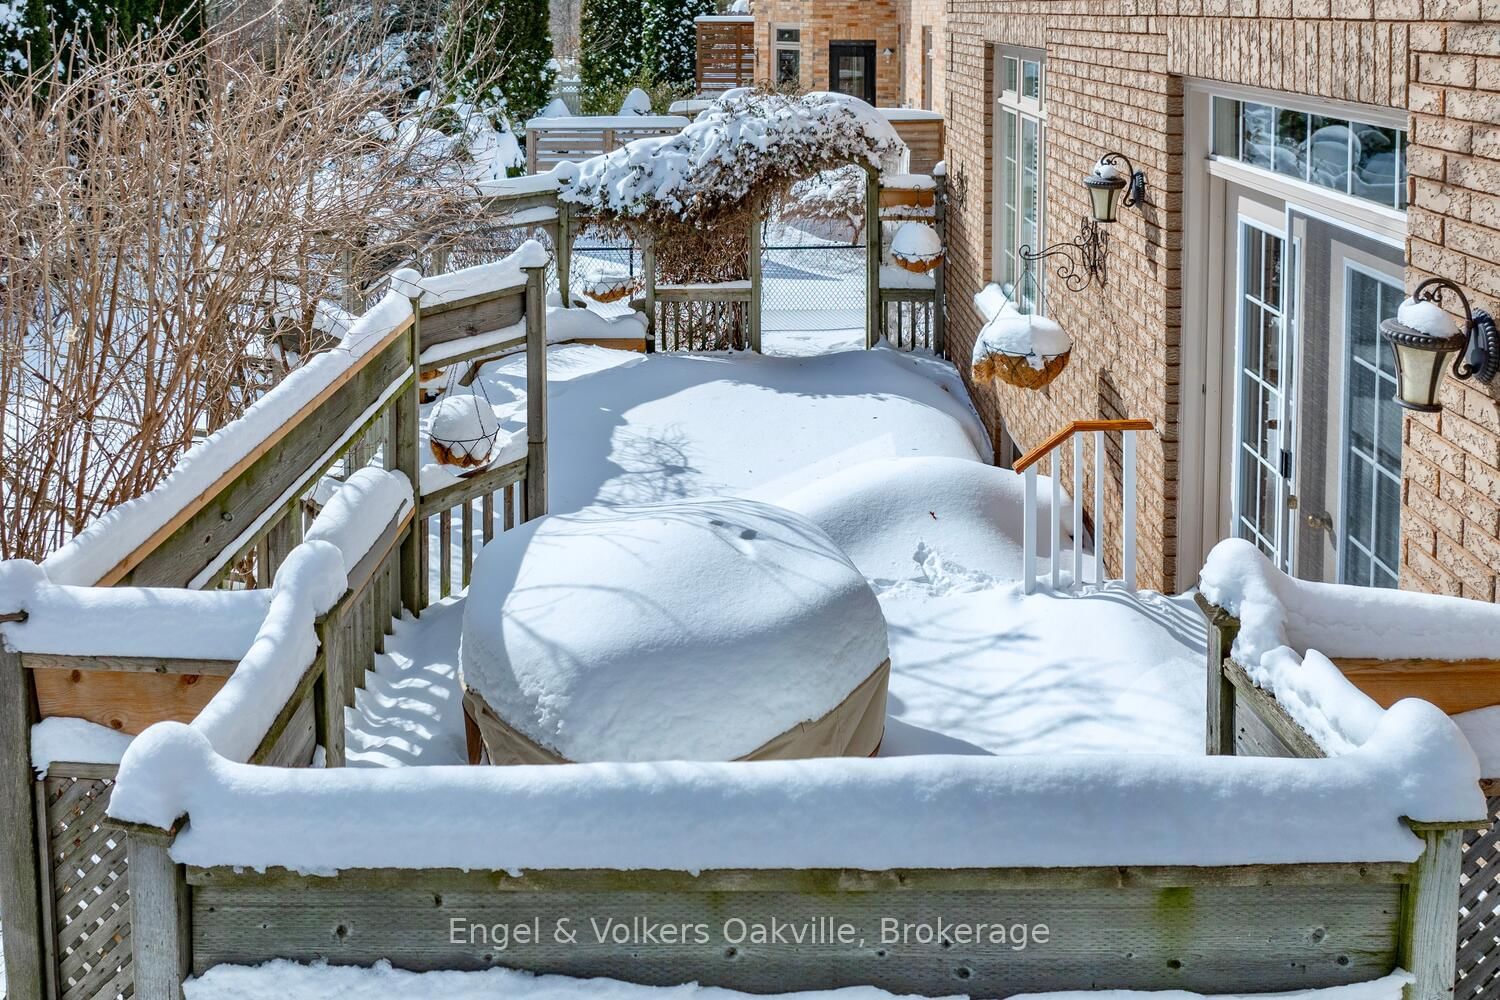
Incredible 4 bed, 2.5 bath executive home with over 2,800 sq ft above grade in the beautiful Westmount neighborhood. Meticulously maintained, & updated for over 25 years, this an ideal family home with an abundance of potential to model to suit your needs. As you enter the grand foyer with 18 ceilings, you immediately feel the warmth of the centre hall plan providing views to all principle rooms, as well as the upstairs. The main floor offers adjoining formal living & dining rooms, while the entire rear of the main floor provides a large eat-in kitchen with breakfast area, open to the family room with gas fp, & walk-out to the rear private deck & landscaped yard. There is also a generous office/den, as well as a 2 pce powder room, & laundry/mud room with access to the double car garage, or via separate door to the side yard, ideal for kids & muddy pets! On the 2nd floor you will find a massive primary bedroom with gas fp, his & hers closets, as well as a 5 pce ensuite with soaker tub & separate shower. The 3 other ample size bedrooms each share a 4 pce bath. The lower level, while partially finished offers an additional 1,525 sq ft of blank canvas to design as you wish. Kitchen appliances (2024), furnace, garage door (2022), front drive/entrance walkway over $25k spent (2020), roof (2017). Walking distance to all amenities, shopping, parks & rec, schools, with easy access to highways & Pearson airport.
All Existing appls LG Thinq fridge/freezer, LG s/s stove, s/s Vent-a-hood fan, s/s Bosch DW, Panasonic MW, Whirlpool W&D. All ELFS, All WDW Cvgs. EGDO + remote. CVac + attachments. Furnace, AC. HWT - Rental
Foyer
Living
Dining
Kitchen
Breakfast
Family
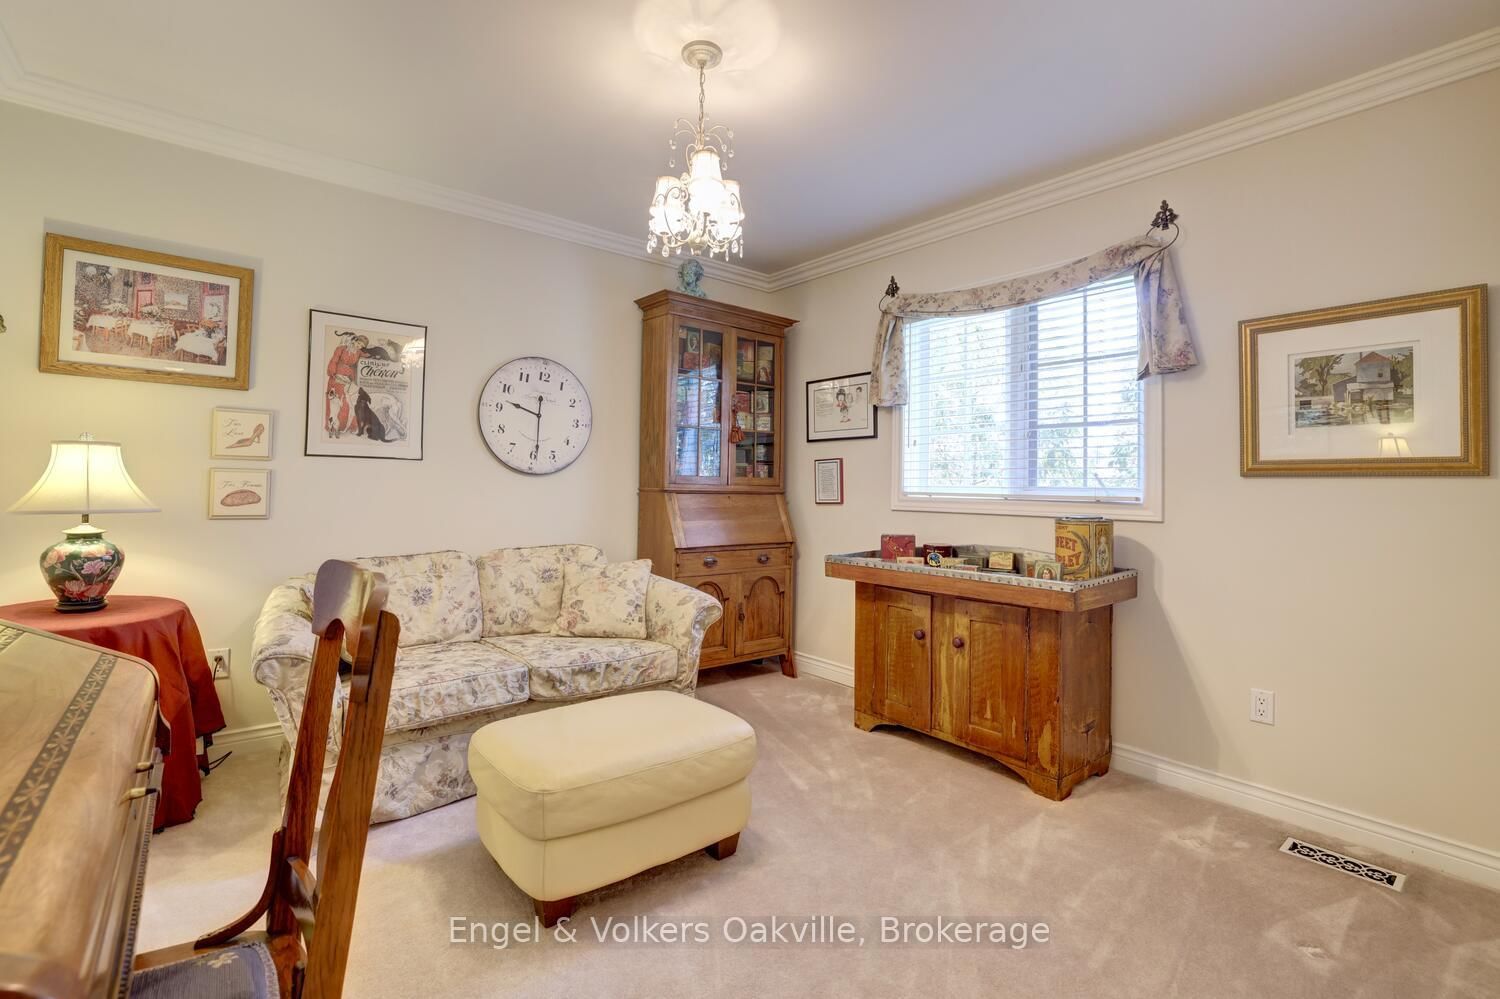
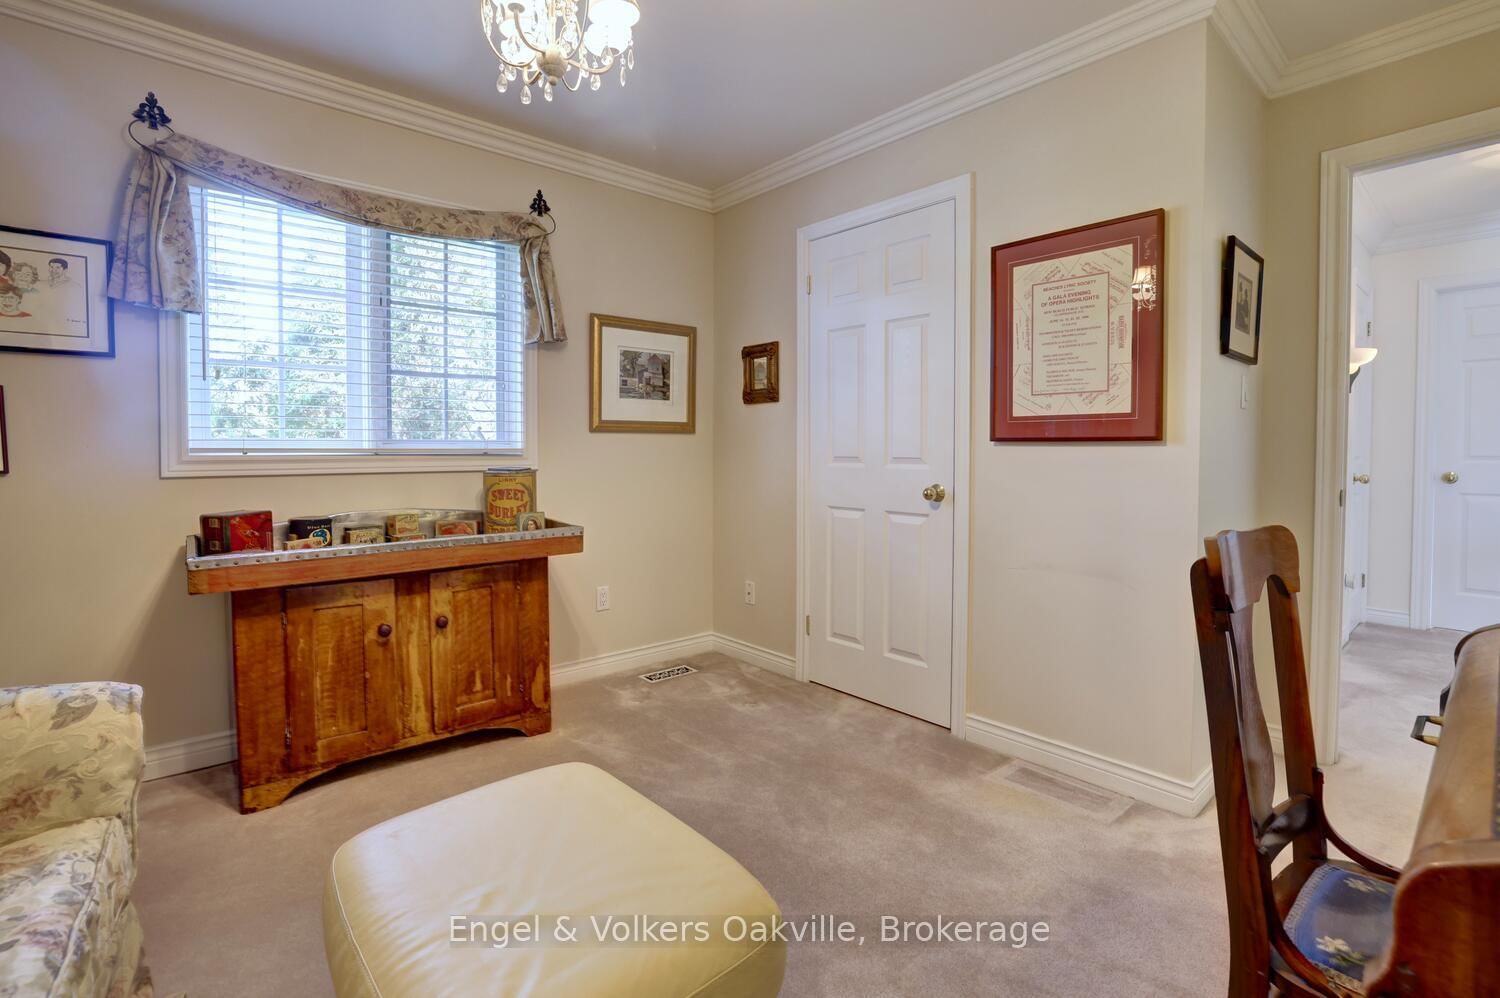
Office
Laundry
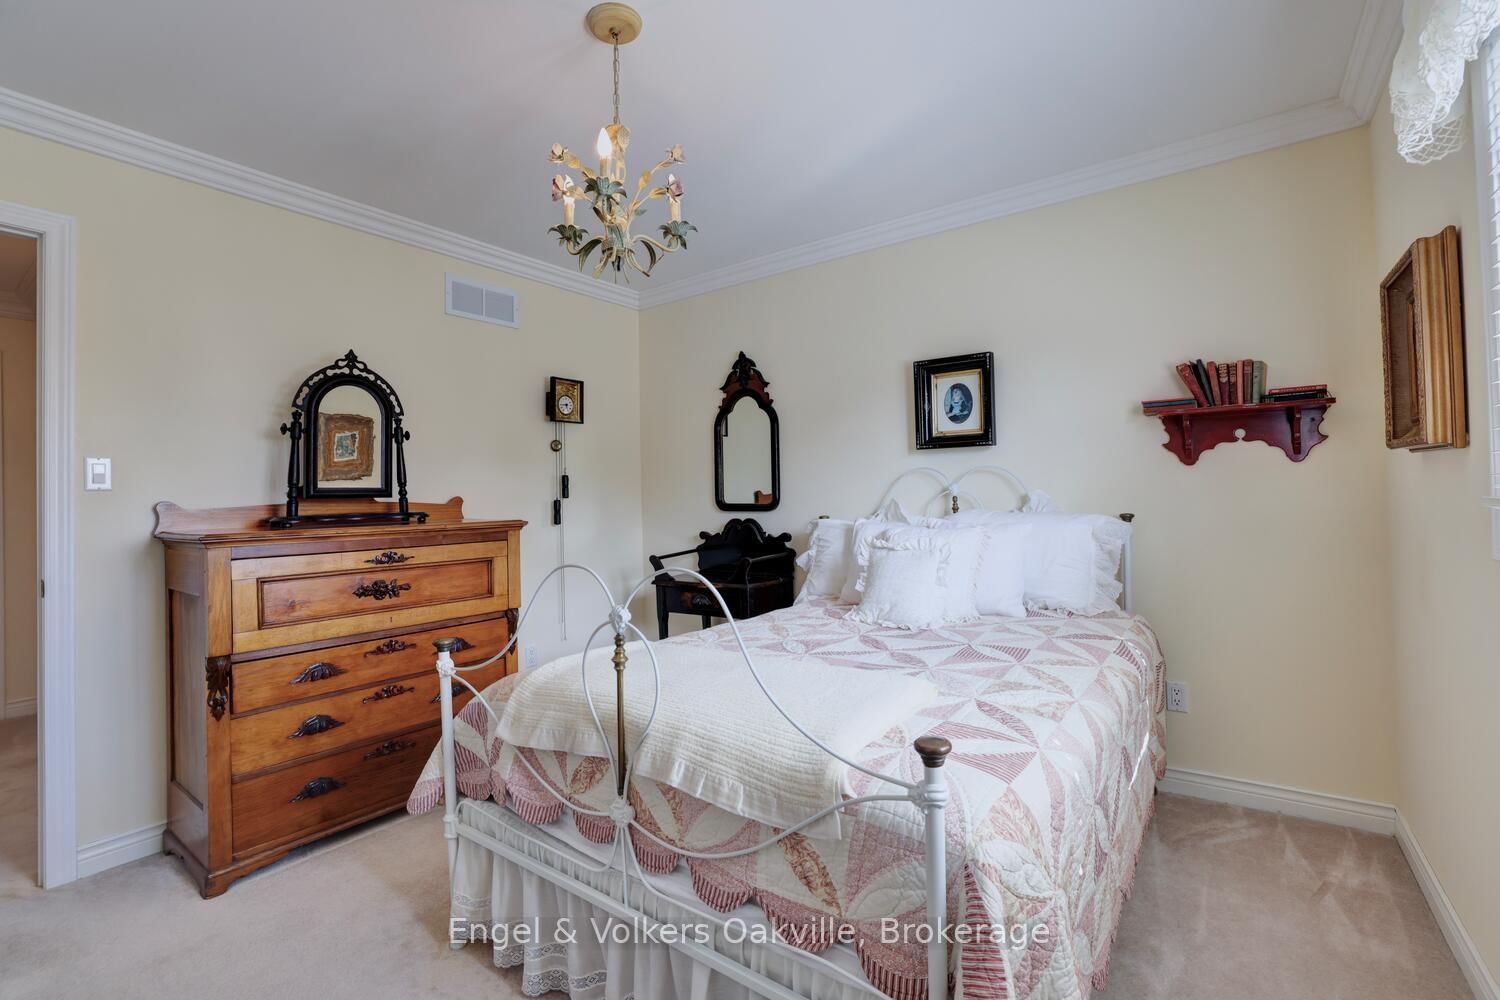
Primary
2nd Br
3rd Br
4th Br
The graph below compares the average list price and average sale price of homes in this neighborhood by month for the last 24 months. When average sale price is greater than average list price, this may suggest a buyer's market. When average sale price is lower than the average list price this may suggest a seller's market.
The graph below illustrates the average days on market for homes in this neighborhood. The yellow area may indicate a buyer's market, the green area may indicate a balanced market and the red area may indicate a seller's market.
Sales Representative, Century 21 People’s Choice Realty Inc., Brokerage
(647) 576 - 2100
Oakville, WT West Oak Trails, L6M 3X9
Oakville, WT West Oak Trails, L6M 3X4
Oakville, WM Westmount, L6M 5G5
Oakville, WT West Oak Trails, L6M 0K6
Oakville, WT West Oak Trails, L6M 3L8